DES (Dark Energy Survey)

Description
The Dark Energy Survey (DES) is a 5000 square degree survey of the Southern sky in grizY aimed at understanding the accelerating expansion of the Universe and the nature of dark energy. DES uses four complementary measurements to probe the evolution of the Universe: weak gravitational lensing, galaxy cluster counts, the large-scale clustering of galaxies (including baryon acoustic oscillations), and the distances to type Ia supernovae. DES uses the Dark Energy Camera (DECam), a 570 Megapixel CCD imaging camera with a 3 square degree field of view installed at the prime focus of on the Blanco 4m telescope at the Cerro Tololo Inter-American Observatory in northern Chile. DES observed for a period of six years (2013-2019), and has collected information from roughly 550 million distant galaxies and 150 million Milky Way stars. DES has also performed a 27 square degree time domain survey aimed at discovering thousands of supernova and other transients.
The DES webpage contains a full description of the survey. For a list of publications from DES, see the DES publications page.
The des_dr2.main table and des_dr1.main table have been crossmatched against our default reference datasets within a 1.5 arcsec radius, nearest neighbor only. These tables will appear with x1p5 in their name in our table browser. Example: des_dr2.x1p5__main__gaia_dr3__gaia_source.
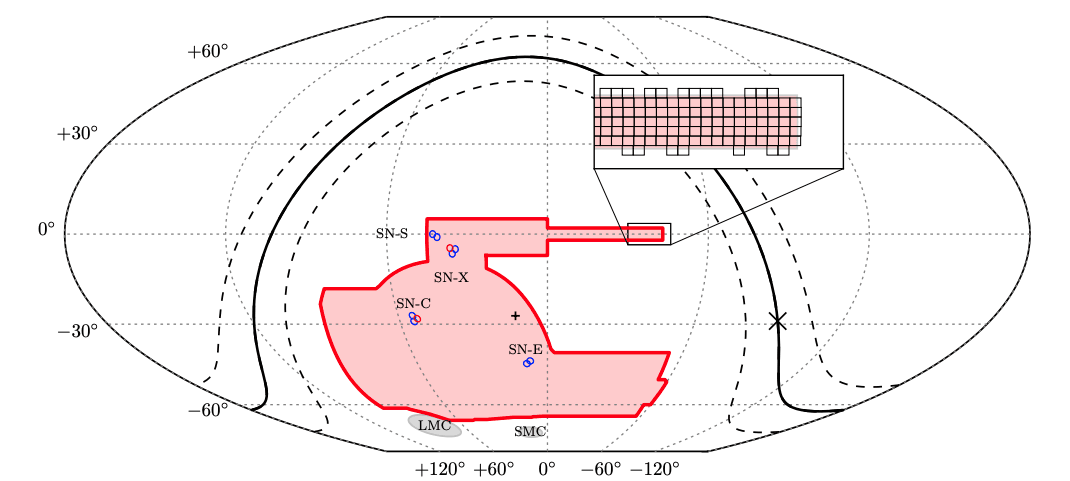
Figure: DES survey footprint from the DES Collaboration (2021)
Scientific Goals
The primary goal of the Dark Energy Survey is to measure the cosmic acceleration of the Universe with high precision. It does this with four complementary cosmological probes:
- Supernovae. DES observes a 27 square degree area, distributed over several fields, with a weekly cadence aimed at discovering thousands of supernovae for use for cosmology.
- Weak gravitational lensing. DES measures the total matter content and structure of the Universe via the weak gravitational lensing of distant galaxies.
- Galaxy clusters. DES detects tens of thousands of galaxy clusters, the most massive gravitationally bound systems in the Universe.
- Galaxy clustering. DES measures the spatial distribution of galaxies which is a sensitive probe of large-scale structure and the primordial distribution of matter.
The DES data enable many other exciting scientific studies, which can be explored through the DES public data releases.
Data Releases
DES DR2
Documentation for DES DR2 can be found in DES Collaboration (2021).
| DES DR2 Summary | |
|---|---|
| Area covered | ∼5000 deg² |
| Bands | grizY |
| Median catalog depth for 1.95 arcsec diameter aperture at S/N∼10 in grizY | 24.7, 24.4, 23.8, 23.1, 21.7 mag |
| Median PSF FWHM in grizY | 1.11, 0.95, 0.88, 0.83, 0.90 arcsec |
| Median astrometric internal precision | ∼27 mas |
| Number of co-added image tiles / exposures | 10,169 / 96,263 |
| Number of objects / galaxies / stellar sources | 691,483,608 / 543 million / 145 million |
| DES DR2 Tables | |
|---|---|
| Table Name | Description |
| coverage | Coverage table; fraction of the Healpix 4096 (Nest) pixel covered by a certain band (values between 0 and 1) (25,239,595 rows) |
| flux | Object flux table (691,483,608 rows) |
| mag | Object magnitude table (691,483,608 rows) |
| main | Main photometry; summary table (691,483,608 rows) |
| DES Y6 cosmology Value-Added Catalogs | |
|---|---|
| Table Name | Description |
| y6_gold | Y6 Gold table (691,483,608 rows) |
| y6_gold_zeropoint | Y6 Gold zeropoint table (5,974,031 rows) |
DES DR1
Documentation for DES DR1 can be found in DES Collaboration (2018).
| DES DR1 Summary | |
|---|---|
| Area covered | ∼5000 deg² |
| Bands | grizY |
| Median catalog depth for 1.95 arcsec diameter aperture at S/N∼10 in grizY | 24.45, 24.3, 23.5, 22.90, 21.70 mag |
| Median PSF FWHM in grizY | 1.12, 0.96, 0.88, 0.84, 0.90 arcsec |
| Median astrometric internal precision | ∼30 mas |
| Number of co-added image tiles | 10,338 |
| Number of objects / galaxies / stellar sources | 399,263,026 / 310 million / 80 million |
| DES DR1 Tables | |
|---|---|
| Table Name | Description |
| des_galex | GALEX (AIS) 1-arcsec crossmatch v. DES DR1 (3,498,599 rows) |
| des_hsc2 | HSC2 1-arcsec crossmatch v. DES DR1 (211,869 rows) |
| des_simbad | SIMBAD 1-arcsec crossmatch v. DES DR1 (729,057 rows) |
| flux | Object flux table (399,263,026 rows) |
| galaxies | Galaxies in DES DR1 (119,478,733 rows) |
| img2coadd | Images contributing to coadded tiles (4,124,753 rows) |
| mag | Object magnitude table (399,263,026 rows) |
| main | Main object summary table (399,263,026 rows) |
| tile_info | Tile information table (10,338 rows) |
| DES DR1 Value-Added Catalogs | |
|---|---|
| Table Name | Description |
| baosample | DES_Y1A1_LSSBAO_v1.1_CATALOG.fits. Main BAO sample catalog detailed in Crocce et al. (2018) (1,300,200 rows) |
| im3shape | Galaxy shape catalogues using a maximum-likelihood bulge/disc model calibrated using simulations, applied to r-band data, yielding 21.9M objects (442,750 rows) |
| mock | Galaxy mock catalogues of the Baryonic Acoustic Oscillation (BAO) angular distance using only photometry (for details, see https://ui.adsabs.harvard.edu/abs/2018MNRAS.479...94A/abstract) (2,375,957,875 rows) |
| mof | Multi-Object Fitting (MOF) Catalogs (for details, see https://des.ncsa.illinois.edu/releases/y1a1/key-catalogs/key-mof) (136,930,995 rows) |
| morph | Morphology Catalog (for details, see https://des.ncsa.illinois.edu/releases/y1a1/gold/morphology) (54,581,334 rows) |
| photo_z | Photometric redshifts catalog (for details, see https://des.ncsa.illinois.edu/releases/y1a1/key-catalogs/key-photoz) (684,654,975 rows) |
| psf | Point spread function catalog (for details, see https://des.ncsa.illinois.edu/releases/y1a1/key-catalogs/key-psf) (14,468,770 rows) |
| sgsep_cosmos_tests_v2 | Star-galaxy separation catalog, covering DES observations from the Science Verification period and other DECam observations over the COSMOS field (for more details, see https://des.ncsa.illinois.edu/releases/y1a1/gold/classification) (116,027 rows) |
| sgsep_hsc_tests_v2 | Star-galaxy separation catalog, covering DES observations from the Science Verification period over two specific fields with Hubble Space Telescope observations (downloaded from the https://archive.stsci.edu/hst/hsc/ site) with the ACS camera (other than COSMOS) appropriate for star-galaxy separation tests (for more details, see https://des.ncsa.illinois.edu/releases/y1a1/gold/classification) (12,927 rows) |
| sgsep_stripe82_tests_v2 | Star-galaxy separation catalog, covering stripe 82 observations from SDSS with DES Y1 data (for more details, see https://des.ncsa.illinois.edu/releases/y1a1/gold/classification) (46,700 rows) |
| sgsep_validation_masked_v3 | Star-galaxy separation catalog, covering observations in the main Y1 footprint with selected columns from Gold, MOF, photo-z and star-galaxy classifiers (for more details, see https://des.ncsa.illinois.edu/releases/y1a1/gold/classification) (97,588,318 rows) |
| sgsep_vvds_tests_v2 | Star-galaxy separation catalog, covering VVDS observations with DES from the Science Verification period (for more details, see https://des.ncsa.illinois.edu/releases/y1a1/gold/classification) (4,442 rows) |
| shape_metacal_flux_griz | Galaxy shape catalogues using a Gaussian model with an innovative internal calibration scheme, applied to riz-bands, yielding 34.8M objects (136,930,995 rows) |
| shape_metacal_riz_unblind | Galaxy shape catalogues using a Gaussian model with an innovative internal calibration scheme, applied to riz-bands, yielding 34.8M objects (136,930,995 rows) |
| DES Y3 cosmology Value-Added Catalogs | |
|---|---|
| Table Name | Description |
| y3_gold | Dark Energy Survey Year 3 - Cosmology Photometric Data Set (399,263,026 rows) |
| y3_gold_footprint | Dark Energy Survey Year 3 - Cosmology Photometric Data Set, Foot Print (25,608,666 rows) |
| y3_gold_surveyconditions | Dark Energy Survey Year 3 - Cosmology Photometric Data Set, Survey Conditions (25,608,666 rows) |
DES SVA1
For a full description of DES SVA1, visit the DES SVA1 GOLD RELEASE page.
| DES SVA1 Tables | |
|---|---|
| Table Name | Description |
| gold_annz2_pdf | The PDFs have the following binning in redshift: z_min = 0.00, z_max = 1.8, nbins = 180 (25,227,559 rows) |
| gold_annz2_point | The structure of the point estimate files are identical. They each contain two columns: the SVA1 unique object identifier and the mean photo-z for that object. (25,227,510 rows) |
| gold_bpz_pdf | The PDFs have the following binning in redshift: z_min = 0.005, z_max = 2.505 , nbins = 250 (25,227,559 rows) |
| gold_bpz_point | The structure of the point estimate files are identical. They each contain two columns: the SVA1 unique object identifier and the mean photo-z for that object. (25,227,559 rows) |
| gold_catalog | The SVA1 GOLD catalog consists of basic astrometry, photometry, and object classification for 25,227,559 objects. (25,227,559 rows) |
| gold_im3shape | This catalog includes the shear estimates made using the Im3Shape algorithm, described in Section 7.3 of Jarvis et al, 2015. (25,227,559 rows) |
| gold_ngmix | This catalog includes the shear estimates made using the NGMix algorithm, described in Section 7.4 of Jarvis et al, 2015. (25,227,559 rows) |
| gold_skynet_pdf | The PDFs have the following binning in redshift: z_min = 0.005, z_max = 1.8, nbins = 200 (25,227,559 rows) |
| gold_skynet_point | The structure of the point estimate files are identical. They each contain two columns: the SVA1 unique object identifier and the mean photo-z for that object. (25,227,559 rows) |
| gold_tpz_pdf | The PDFs have the following binning in redshift: z_min = 0.0012625, z_max = 1.9962625, nbins = 200 (25,227,559 rows) |
| gold_tpz_point | The structure of the point estimate files are identical. They each contain two columns: the SVA1 unique object identifier and the mean photo-z for that object. (25,227,559 rows) |
| gold_wlinfo | This catalog is merely for convenience, containing only information derived from other SVA1 catalogs. (25,227,559 rows) |
| redmagic_bright | redMaGiC red galaxy catalog; bright redMaGiC samples. See Rozo et al. (2015), Table B2. (22,034 rows) |
| redmagic_faint | redMaGiC red galaxy catalog; faint redMaGiC samples. See Rozo et al. (2015), Table B2. (109,491 rows) |
| redmapper_exp_area | The RedMaPPer expanded catalog. Effective Area. See Rykoff et al. (2016), Table 12. (850 rows) |
| redmapper_exp_catalog | The RedMaPPer expanded catalog. Cluster Catalog. See Rykoff et al. (2016), Table 8. (1,382 rows) |
| redmapper_exp_members | The RedMaPPer expanded catalog. Member Catalog. See Rykoff et al. (2016), Table 9. (90,679 rows) |
| redmapper_exp_randoms | The RedMaPPer expanded catalog. Random Point. See Rykoff et al. (2016), Table 11. (1,794,046 rows) |
| redmapper_exp_zmask | The RedMaPPer expanded catalog. Zmask. See Rykoff et al. (2016), Table 10. (1,137,652 rows) |
| redmapper_pub_area | The fiducial catalog with a more conservative footprint and star/galaxy separation. Effective Area. See Rykoff et al. (2016), Table 12. (850 rows) |
| redmapper_pub_catalog | The fiducial catalog with a more conservative footprint and star/galaxy separation. Cluster Catalog. See Rykoff et al. (2016), Table 8. (787 rows) |
| redmapper_pub_members | The fiducial catalog with a more conservative footprint and star/galaxy separation. Member Catalog. See Rykoff et al. (2016), Table 9. (48,937 rows) |
| redmapper_pub_randoms | The fiducial catalog with a more conservative footprint and star/galaxy separation. Random Point. See Rykoff et al. (2016), Table 11. (612,996 rows) |
| redmapper_pub_zmask | The fiducial catalog with a more conservative footprint and star/galaxy separation. Zmask. See Rykoff et al. (2016), Table 10. (727,400 rows) |
| Back to Top |
Data Reduction
The DES data are processed through the DES Data Management (DESDM) pipeline, which includes image detrending and photometry (Morganson et al. 2018). The photometry is performed with modified versions of the Astromatic software suite, in particular the SExtractor and PSFEx packages. Users of these packages will find many of the column names in the DES tables to be familiar.
Data Access
The DES data are accessible by a variety of means:
Data Lab Table Access Protocol (TAP) service
TAP provides a convenient access layer to the DES catalog database. TAP-aware clients (such as TOPCAT) can point to https://datalab.noirlab.edu/tap, select the des_dr2 database, and see the database tables and descriptions. You can also view the DES tables and descriptions in the Data Lab table browser.
Data Lab Query Client
The Query Client is available as part of the Data Lab software distribution. The Query Client provides a Python API to Data Lab database services. These services include anonymous and authenticated access through synchronous or asynchronous queries of the catalog made directly to the database. Additional Data Lab services for registered users include personal database storage and storage through the Data Lab VOSpace.
The Query Client can be called from a Jupyter Notebook on the Data Lab Notebook server. Example notebooks are provided to users upon creation of their user account (register here), and are also available to browse on GitHub at https://github.com/astro-datalab/notebooks-latest.
Image Cutouts
The Data Lab Simple Image Access (SIA) service provides a fast way to retrieve cutouts from DES images. For an example of how to use the SIA service, look at the example Jupyter notebook. For DES DR2, the SIA URL is:
https://datalab.noirlab.edu/sia/des_dr2
For DES DR1, the SIA URL is:
https://datalab.noirlab.edu/sia/des_dr1
For DES SVA1, the SIA URL is:
https://datalab.noirlab.edu/sia/des_sva1
For DES Y1-Y4, the SIA URLs are:
https://datalab.noirlab.edu/sia/des_y1
https://datalab.noirlab.edu/sia/des_y2
https://datalab.noirlab.edu/sia/des_y3
https://datalab.noirlab.edu/sia/des_y4
Jupyter Notebook Server
The Data Lab Jupyter Notebook server (authenticated service) contains several examples of how to access and visualize the DES catalog:
- Dwarf galaxies in DES DR1
- Star/Galaxy/QSO Classification in the Dark Energy Survey (DES)
- Stellar Streams with DES DR1
Acknowledgments
Long Version: This project used public archival data from the Dark Energy Survey (DES). Funding for the DES Projects has been provided by the U.S. Department of Energy, the U.S. National Science Foundation, the Ministry of Science and Education of Spain, the Science and Technology Facilities Council of the United Kingdom, the Higher Education Funding Council for England, the National Center for Supercomputing Applications at the University of Illinois at Urbana–Champaign, the Kavli Institute of Cosmological Physics at the University of Chicago, the Center for Cosmology and Astro-Particle Physics at the Ohio State University, the Mitchell Institute for Fundamental Physics and Astronomy at Texas A&M University, Financiadora de Estudos e Projetos, Fundação Carlos Chagas Filho de Amparo à Pesquisa do Estado do Rio de Janeiro, Conselho Nacional de Desenvolvimento Científico e Tecnológico and the Ministério da Ciência, Tecnologia e Inovação, the Deutsche Forschungsgemeinschaft and the Collaborating Institutions in the Dark Energy Survey.
The Collaborating Institutions are Argonne National Laboratory, the University of California at Santa Cruz, the University of Cambridge, Centro de Investigaciones Enérgeticas, Medioambientales y Tecnológicas–Madrid, the University of Chicago, University College London, the DES-Brazil Consortium, the University of Edinburgh, the Eidgenössische Technische Hochschule (ETH) Zürich, Fermi National Accelerator Laboratory, the University of Illinois at Urbana-Champaign, the Institut de Ciències de l'Espai (IEEC/CSIC), the Institut de Física d'Altes Energies, Lawrence Berkeley National Laboratory, the Ludwig-Maximilians Universität München and the associated Excellence Cluster Universe, the University of Michigan, the National Optical Astronomy Observatory, the University of Nottingham, the Ohio State University, the OzDES Membership Consortium, the University of Pennsylvania, the University of Portsmouth, SLAC National Accelerator Laboratory, Stanford University, the University of Sussex, and Texas A&M University.
Based in part on observations at Cerro Tololo Inter-American Observatory, National Optical Astronomy Observatory, which is operated by the Association of Universities for Research in Astronomy (AURA) under a cooperative agreement with the National Science Foundation.
Database access and other data services are provided by the Astro Data Lab.
LaTeX version: This project used public archival data from the Dark Energy Survey (DES). Funding for the DES Projects has been provided by the U.S. Department of Energy, the U.S. National Science Foundation, the Ministry of Science and Education of Spain, the Science and Technology FacilitiesCouncil of the United Kingdom, the Higher Education Funding Council for England, the National Center for Supercomputing Applications at the University of Illinois at Urbana-Champaign, the Kavli Institute of Cosmological Physics at the University of Chicago, the Center for Cosmology and Astro-Particle Physics at the Ohio State University, the Mitchell Institute for Fundamental Physics and Astronomy at Texas A&M University, Financiadora de Estudos e Projetos, Funda{\c c}{~a}o Carlos Chagas Filho de Amparo {`a} Pesquisa do Estado do Rio de Janeiro, Conselho Nacional de Desenvolvimento Cient{'i}fico e Tecnol{'o}gico and the Minist{'e}rio da Ci{^e}ncia, Tecnologia e Inova{\c c}{~a}o, the Deutsche Forschungsgemeinschaft, and the Collaborating Institutions in the Dark Energy Survey.
The Collaborating Institutions are Argonne National Laboratory, the University of California at Santa Cruz, the University of Cambridge, Centro de Investigaciones Energ{'e}ticas, Medioambientales y Tecnol{'o}gicas-Madrid, the University of Chicago, University College London, the DES-Brazil Consortium, the University of Edinburgh, the Eidgen{"o}ssische Technische Hochschule (ETH) Z{"u}rich, Fermi National Accelerator Laboratory, the University of Illinois at Urbana-Champaign, the Institut de Ci{`e}ncies de l'Espai (IEEC/CSIC), the Institut de F{'i}sica d'Altes Energies, Lawrence Berkeley National Laboratory, the Ludwig-Maximilians Universit{"a}t M{"u}nchen and the associated Excellence Cluster Universe, the University of Michigan, the National Optical Astronomy Observatory, the University of Nottingham, the Ohio State University, the OzDES Membership Consortium, the University of Pennsylvania, the University of Portsmouth, SLAC National Accelerator Laboratory, Stanford University, the University of Sussex, and Texas A&M University.
Based in part on observations at Cerro Tololo Inter-American Observatory, National Optical Astronomy Observatory, which is operated by the Association of Universities for Research in Astronomy (AURA) under a cooperative agreement with the National Science Foundation.
Database access and other data services are provided by the Astro Data Lab.
Short version (for articles in Letters journal ONLY): This project used public archival data from the Dark Energy Survey (DES). Funding for the DES Projects has been provided by the DOE and NSF (USA), MISE (Spain), STFC (UK), HEFCE (UK), NCSA (UIUC), KICP (U. Chicago), CCAPP (Ohio State), MIFPA (Texas A&M), CNPQ, FAPERJ, FINEP (Brazil), MINECO (Spain), DFG (Germany) and the collaborating institutions in the Dark Energy Survey, which are Argonne Lab, UC Santa Cruz, University of Cambridge, CIEMAT-Madrid, University of Chicago, University College London, DES-Brazil Consortium, University of Edinburgh, ETH Zürich, Fermilab, University of Illinois, ICE (IEEC-CSIC), IFAE Barcelona, Lawrence Berkeley Lab, LMU München and the associated Excellence Cluster Universe, University of Michigan, NOAO, University of Nottingham, Ohio State University, OzDES Membership Consortium, University of Pennsylvania, University of Portsmouth, SLAC National Lab, Stanford University, University of Sussex, and Texas A&M University.
Based in part on observations at Cerro Tololo Inter-American Observatory, National Optical Astronomy Observatory, which is operated by the Association of Universities for Research in Astronomy (AURA) under a cooperative agreement with the National Science Foundation.
Database access and other data services are provided by the Astro Data Lab.
LaTeX version: This project used public archival data from the Dark Energy Survey (DES). Funding for the DES Projects has been provided by the DOE and NSF (USA), MISE (Spain), STFC (UK), HEFCE (UK), NCSA (UIUC), KICP (U. Chicago), CCAPP (Ohio State), MIFPA (Texas A&M), CNPQ, FAPERJ, FINEP (Brazil), MINECO (Spain), DFG (Germany) and the collaborating institutions in the Dark Energy Survey, which are Argonne Lab, UC Santa Cruz, University of Cambridge, CIEMAT-Madrid, University of Chicago, University College London, DES-Brazil Consortium, University of Edinburgh, ETH Z{"u}rich, Fermilab, University of Illinois, ICE (IEEC-CSIC), IFAE Barcelona, Lawrence Berkeley Lab, LMU M{"u}nchen and the associated Excellence Cluster Universe, University of Michigan, NOAO, University of Nottingham, Ohio State University, OzDES Membership Consortium, University of Pennsylvania, University of Portsmouth, SLAC National Lab, Stanford University, University of Sussex, and Texas A&M University.
Based in part on observations at Cerro Tololo Inter-American Observatory, National Optical Astronomy Observatory, which is operated by the Association of Universities for Research in Astronomy (AURA) under a cooperative agreement with the National Science Foundation.
Database access and other data services are provided by the Astro Data Lab.