Data Surveys
Data Surveys
Astro Data Lab hosts over 30 astronomical surveys, both images and catalogs, published across the astronomical spectrum, ranging from nearby asteroids and local universe to far, extragalactic sources, generally hosted with the approval and/or help of their authors. For some datasets, we host more than one data release.
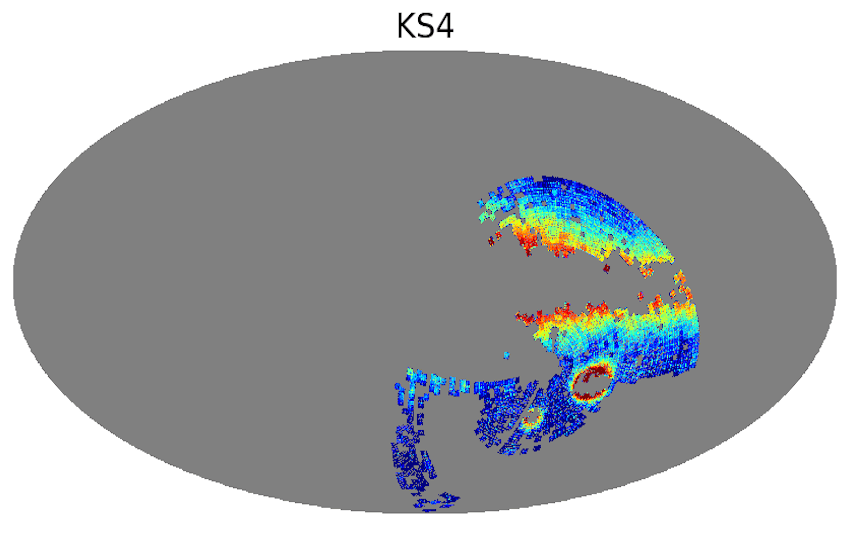
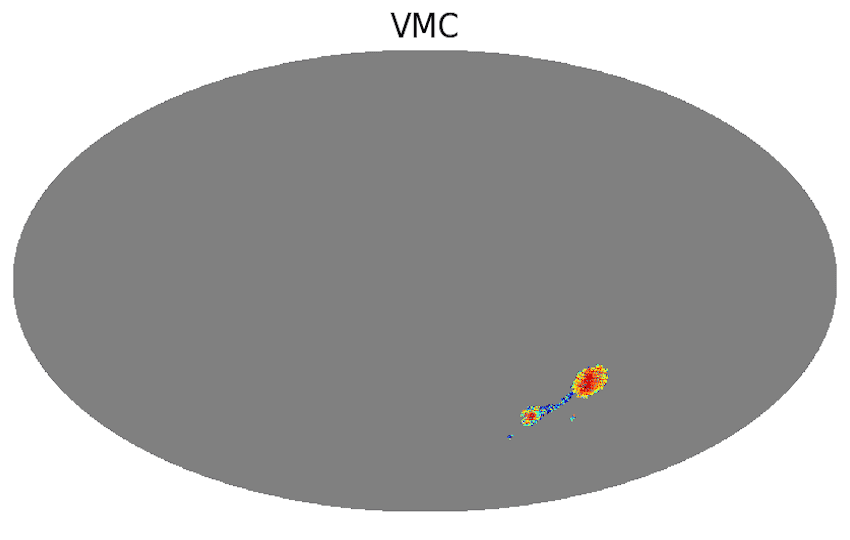
Survey Sky Maps
Click on a map below to learn more about the dataset.


Catalogs
| Survey | Description |
|---|---|
| AllWISE | Full-sky infrared source catalog combining all WISE observations. |
| Buzzard | Simulated galaxy catalog for testing large-scale structure and weak lensing analyses. |
| CatWISE2020 | Proper-motion catalog from multi-epoch WISE data optimized for faint IR sources. |
| DECam Asteroid Database (DAD) | Catalog of asteroid detections from DECam imaging. |
| DECaPS | Deep optical survey of the southern Galactic plane using DECam. |
| DELVE | Deep, wide-field survey of the southern sky focused on Milky Way halo structure. |
| DeMCELS | Survey of the Magellanic Clouds in emission lines and continuum light. |
| DES | Wide-field optical survey probing dark energy via galaxies, supernovae, and large-scale structure. |
| DESI | Spectroscopic survey mapping galaxy redshifts to study dark energy and cosmic expansion. |
| Euclid | Space mission mapping billions of galaxies to study dark energy and dark matter. |
| Gaia | High-precision astrometric mission measuring positions, distances, and motions of over a billion stars. |
| GNIRS-DQS | Near-infrared spectroscopic survey of distant quasars with Gemini GNIRS. |
| GOGREEN and GCLASS | Spectroscopic surveys of galaxy clusters at intermediate to high redshift. |
| Hipparcos | Early space astrometry mission providing precise stellar parallaxes and proper motions. |
| KS4 | Planned wide-field spectroscopic survey targeting cosmology and galaxy evolution. |
| Legacy Surveys | Imaging surveys supporting DESI target selection across optical bands. |
| LSST-SIM | Simulated datasets for the Rubin Observatory LSST survey. |
| NSC | NOIRLab Source Catalog combining heterogeneous optical imaging into a unified dataset. |
| Palomar Gattini-IR (PGIR) | Time-domain infrared survey searching for transients and variables. |
| PHAT | Panchromatic survey of the Andromeda galaxy across UV to IR wavelengths. |
| PHATTER | Extended PHAT-like survey focusing on resolved stellar populations in nearby galaxies. |
| SDSS | Landmark optical and spectroscopic survey mapping galaxies, quasars, and stars. |
| SGA | Catalog of nearby large galaxies derived from Legacy Surveys imaging. |
| SkyMapper | Southern-sky optical survey with multi-band photometry. |
| SMASH | Deep imaging survey of the Magellanic Clouds and their stellar outskirts. |
| S-PLUS | Optical survey using multiple narrow- and broad-band filters for stellar and galaxy studies. |
| 2MASS | All-sky near-infrared survey of stars and galaxies. |
| Tycho-2 | Star catalog with astrometry and photometry derived from Hipparcos mission data. |
| UKIDSS | Deep near-infrared surveys conducted with UKIRT. |
| unWISE | Deep coadds of WISE infrared imaging optimized for faint source detection. |
| USNO | Series of astrometric catalogs from the U.S. Naval Observatory. |
| VHS | VISTA Hemisphere Survey mapping the southern sky in near-infrared. |
| VMC | VISTA survey of the Magellanic Clouds focusing on stellar populations and structure. |
Reference Catalogs
From these surveys, we have considered 5 as the most important and used them as reference to crossmatch with all other surveys. They are AllWISE, Gaia DR3 (for astrometry), NSC DR2, SDSS DR17 (for spectroscopy), and unWISE DR1 (for photometry), and vice versa. All main object tables have been crossmatched against our default reference datasets within a 1.5 arcsec radius, nearest neighbor only. These tables will appear with x1p5 in their name in our table browser. Example: phat_v3.x1p5__phot_mod__gaia_dr3__gaia_source.
Added Columns
For convenience to our users, we have added some of the following columns to several of the catalogs when they did not have them originally:
- elon - Ecliptic Longitude (deg)
- elat - Ecliptic Latitude (deg)
- glon - Galactic Longitude (deg)
- glat - Galactic Latitude (deg)
- htm9 - Hierarchical Triangular Mesh (HTM) index (order 9 => ~10 arcmin size)
- ring256 - HEALPIX index (Nsides 256, Ring scheme => ~14 arcmin size)
- nest4096 - HEALPIX index (Nsides 4096, Nest scheme => ~52 arcsec size)
- random_id - Random ID assigned for random sampling, uniformly spread across all catalog rows, ranging from 0 to 100
Some names for these columns may be different in some catalogs.
In some photometric catalogs that have fluxes, we have also calculated AB magnitudes, using the formula
mag = 22.5 - 2.5log10(flux)
where the flux is the flux of the object in nanomaggies. We added them, generally following the standard nomenclature, depending on the band used. For example:
- mag_g
- mag_r
- mag_i
- mag_z
If the inverse flux variance is provided, we usually calculated signal-to-noise ratio values based on the formula
snr = flux * sqrt(flux_ivar)
where flux_ivar is the inverse flux variance. We added them with the usual nomenclature. For example:
- snr_g
- snr_r
- snr_i
- snr_z
Some catalogs have other columns calculated and added as well, like de-reddend fluxes and magnitudes, colors, etc.
Caveat: Data Type Discrepancies
Some data types in our TapSchema may not exactly match how they are stored in the underlying database. These discrepancies primarily affect columns labeled as DOUBLE or VARCHAR, which in certain cases are implemented differently behind the scenes. While these differences generally do not impact standard usage, they may be relevant for advanced queries or data handling. The following subsections outline the specific cases where such mismatches occur and how they are represented.
NUMERIC
Be aware that some columns in our database are stored using the high-precision NUMERIC data type but are exposed through TAP as VARCHAR. This is done to ensure that very large values (such as identifiers) are returned accurately and without truncation or overflow. In most cases, these columns serve as unique identifiers and can be safely used as strings for filtering, joins, and cross-matching. If you need to perform arithmetic operations on these columns, you can explicitly cast them within your query. For example:
SELECT CAST(id AS DOUBLE PRECISION) AS id_numeric
FROM desi_dr1.ztile
Please note that casting to numeric types such as DOUBLE may result in a loss of precision for very large values. If exact precision is required, we recommend continuing to treat these columns as strings or to process them with a large-enough numeric datatype.
Columns affected by this mismatch are identified in their descriptions. Column descriptions for each table are available on our Data Explorer page. For convenience, each column with the NUMERIC data type is also listed below:
ARRAY
Be aware that some columns are labeled as DOUBLE in our TapSchema but are actually stored as ARRAY (or double precision[]) in our database. If there is a mismatch, it will be noted in the column description. Column descriptions for each table are available on our Data Explorer page. For convenience, each column with the ARRAY (or double precision[]) data type is also listed below:
| Table Name | Column Name | TapSchema Data Type | Database Data Type |
|---|---|---|---|
| desi_dr1.mws | covar | DOUBLE | double precision[] |
| desi_dr1.mws | elem | DOUBLE | double precision[] |
| desi_dr1.mws | elem_err | DOUBLE | double precision[] |
| desi_dr1.mws | param | DOUBLE | double precision[] |
| desi_dr1.stellar_mass_emline | xj_sl | DOUBLE | double precision[] |
See the example code below on how to query and convert these columns into a matrix value:
=================================

from dl import queryClient as qc
import numpy as np
import pandas as pd
from io import StringIO

query = '''SELECT * FROM desi_dr1.mws
            LIMIT 10
        '''

# Save the query in default format (string with comma-separated values).

res = qc.query(sql=query)

# Starting from 'res' as the result from the qc.query() call in default
# format (csv string), the following properly formats the array columns.
# Those need to be listed manually.
# Define the converter to split the array values and convert to float.
# Note: the x[1:-1] gets rid of the opening and closing curly brackets
# in the CSV string.

float_converter = lambda x: np.array(x[1:-1].split(','), dtype='float')

# Define the converters for all array columns.

converters = {'covar': float_converter,
              'elem': float_converter,
              'elem_err': float_converter,
              'param': float_converter}

# Read into a pandas DataFrame.

df = pd.read_csv(StringIO(res), converters=converters)

=================================