GOGREEN and GCLASS

GOGREEN and GCLASS Second Data Release at NOIRLab's Astro Data Lab
DR1 released at Astro Data Lab on August 11, 2020.
DR2 released at Astro Data Lab on May 21, 2025.
This is the second Public Data Release (DR2) of all GOGREEN and GCLASS data. It includes new photometric data and catalogues for one cluster, SpARCS1033. In addition some minor errors in DR1 have been fixed. A description of the changes from DR1 can be found in this document. The data structure and content is largely the same as DR1. Any use of these data should cite the published DR1 paper.
Data Lab Primer and Disclaimer
Hosting of the GOGREEN and GCLASS Data Release products at Astro Data Lab is the result of a pilot project between the GOGREEN survey team, the Gemini Large-and-Long-Program (LLP), and NOIRLab's Astro Data Lab at the Community Science and Data Center (CSDC).
The biggest benefit of a science platform such as Data Lab is that you don't have to download any data or install any software on your local computer. All data and necessary code are installed remotely on our science platform, and all you need to start working with the data is a web browser. Using a Jupyter notebook framework you have the power of Python at your fingertips, with all software packages installed, and coupled with co-located access to enormous data sets for joint analysis. And to the GOGREEN and GCLASS Data Release data products, of course.
The gogreen_dr2.photo table and the gogreen_dr2.redshift table have been crossmatched against our default reference datasets within a 1.5 arcsec radius, nearest neighbor only. These tables will appear with x1p5 in their name in our table browser. Example: gogreen_dr1.x1p5__photo__gaia_dr3__gaia_source.
Data Access at Astro Data Lab
The GOGREEN and GCLASS data are accessible by a variety of means:
Data Lab Table Access Protocol (TAP) service
TAP provides a convenient access layer to the GOGREEN catalog database. TAP-aware clients (such as TOPCAT) can point to https://datalab.noirlab.edu/tap, select the gogreen_dr2 database, and see the database tables and descriptions. You can also view the GOGREEN tables and descriptions in the Data Lab table browser.
Data Lab Query Client
The Query Client is available as part of the Data Lab software distribution. The Query Client provides a Python API to Data Lab database services. These services include anonymous and authenticated access through synchronous or asynchronous queries of the catalog made directly to the database. Additional Data Lab services for registered users include personal database storage and storage through the Data Lab VOSpace.
The Query Client can be called from a Jupyter Notebook on the Data Lab Notebook server. Example notebooks are provided to users upon creation of their user account (register here), and are also available to browse on GitHub at https://github.com/astro-datalab/notebooks-latest.
Image Cutouts
The Data Lab Simple Image Access (SIA) service provides a fast way to retrieve cutouts from GOGREEN and GCLASS images. For an example of how to use the SIA service with GOGREEN, look at the example Jupyter notebook for DR1 (DR2 version coming soon). For GOGREEN DR2, the SIA URL is:
https://datalab.noirlab.edu/sia/gogreen_dr2
Jupyter Notebook Server
The Data Lab Jupyter Notebook server (authenticated service) contains several examples of how to access and visualize the GOGREEN and GCLASS catalog:
- Listing files in the GOGREEN DR1 Dataset
- GOGREEN Data Release 1 data access at Astro Data Lab
- GOGREEN DR1 at Data Lab - Simple Image Access (SIA)
- GOGREEN DR1: Galaxy Cluster Membership
- Intro to Spectroscopy from the GOGREEN DR1 Dataset
Acknowledgments and Citations
If you make use of these data in your research, please cite the Data Release paper, Balogh et al. (2021). In addition, depending on your usage:
- The GOGREEN survey description paper, Balogh et al. (2017), where the survey strategy, sample selection and parts of the data reduction are described in more detail.
- The data reduction and analysis of SpARCS1033 is presented in Hewitt, Balogh et al. (2025, submitterd). Users that make use of data from this cluster should cite that paper as well.
- Muzzin et al. (2012), for more details about the GCLASS survey and data reduction
- Research that makes significant use of the GOGREEN photometric catalogues should cite van der Burg et al. (2020) for details of data reduction and measurements.
- Any research that makes use of the reduced HST/WFC3 F160W imaging of the GOGREEN clusters should cite Chan et al. (2021). Research that uses the HST/WFC3 F140W imaging of the GCLASS clusters should cite Matharu et al. (2019).
- Spectroscopy in the SXDF and COSMOS fields is coupled with photometry from the SPLASH and Ultravista surveys, respectively. Please cite Mehta et al. (2018) and/or Muzzin et al. (2013) if you make use of these data.
Cluster Sample
This data release includes data on all GOGREEN and GCLASS clusters. From Table 1 in the Data Release Paper:
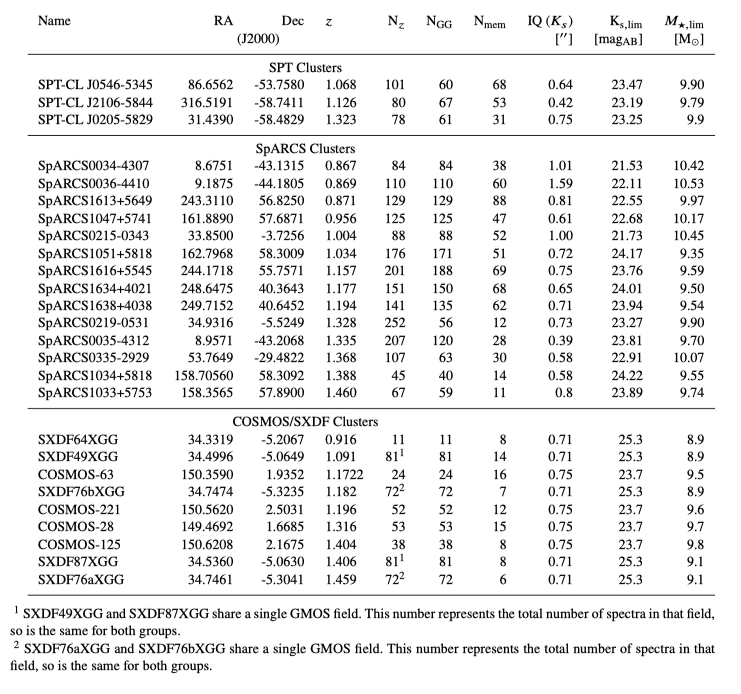
Table 1 from the DR2 paper, describing the 26 clusters in GCLASS and GOGREEN, their positions, redshifts, and information about the number of spectra and members.
File Structure
Scripts
In directory Scripts/
We provide two Jupyter notebooks with some code to read and manipulate the data tables. We strongly suggest using these as a starting point for your analysis to avoid common mistakes and ensure you are using the right source of the data.
DR2_Notebook: Provides examples for reading the data, displaying spectra and images, and reproducing many of the plots in the DR1 paper. Also includes some sample code to access the 1D and 2D spectra, and associated imaging, to examine objects and make calculations.build_Table3: This is a script to build Photo.fits (Table 3 in the Data release paper) from the various associated photometric files. This is useful if you want to customizePhoto.fitsfurther (e.g. adding other information that is not currently included), or for examples of where to find relevant information and how to work with it.- 'DR2 stats and checks': some scripts for comparing the catalogues of DR2 with those of DR1, to illustrate the additional features and corrected errors. It also includes code to compute the number of redshifts and members reported in Table 1, and the velocity dispersions in column 2 of Table 2 of the DR2 paper.
- 'Checkphotozp': Used to compare our photometry to that of PanStarrs (see DR2 paper)
CATS (Catalogues)
For many applications, this is all you will need.
In directory CATS/
Clusters.fits: is a FITS table with information about each group or cluster in the sample. Described in Table 4 of the DR2 paper.Redshift_catalogue.fits: This is a catalogue of all unique objects (mostly galaxies) with either GCLASS or GOGREEN spectroscopy. Includes redshifts, line indices and other information as described in Table 6 of the DR2 paper.Photo.fits: Contains all sources with good photometry in all available filters, and a subset of relevant columns extracted from the photometric catalogues. Matches with the spectroscopic sample are identified. It is described in Table 5 of the DR2 paper. It is conservative in the sense that objects are excluded if they are missing data in even one filter (totmask=0in original catalogues).
SPECTROSCOPY
In directory SPECTROSCOPY/
If you want the 1D and 2D spectra, you will need this directory as well.
For each cluster there is a file called SPECTROSCOPY/OneD/CLUSTER_final.fits. This is a multiextension FITS (MEF) file containing 1D spectra for all unique objects in CLUSTER, from GOGREEN and GCLASS.
| FITS Extension | Description |
|---|---|
| [SCI,i] for i=1,N | science data. Absolute flux calibrated 1D spectra for each target i of N. |
| [VAR,i] for i=1,N | Corresponding variance array. |
| [DQ,i] for i=1,N | data quality array (GOGREEN spectra only). Here this corresponds to the number of pixels extracted in each column. So DQ=0 means no data and in general DQ<5 or so means a badly contaminated column for one reason or another. Shouldn't usually need to worry about this as the VAR array contains what you need. |
| [MDF] | A FITS table with information about the target. |
The corresponding 2D spectra are in SPECTROSCOPY/TwoD/CLUSTER_twod.fits. Important notes about these:
- These only include GOGREEN spectra. So the dimension of the MEF does not always match that of the 1D file. In the latter, the GCLASS spectra are appended to the GOGREEN spectra, so the entries in the 2D file should align with the first entries in the 1D.
- No relative or absolute flux calibration has been applied to these spectra
- The spatial dimension is in pixels, with a pixel scale of 0.16"
PHOTOMETRY
In directory PHOTOMETRY/
The photometry is arranged in different subdirectories. Note there are some differences between the data formats and availability for the five GCLASS clusters that are not part of GOGREEN. Please read the README and README.gclass documentation carefully.
The Photo.fits file provided in the CATS/ directory provides the most commonly used photometric information, for all systems, in a homogeneous way. This is the safest way to access the data. We provide the python script that generates this file, which would be a good starting point if you want to access other information.
IMAGES
In directory PHOTOMETRY/IMAGES/
This is the largest subdirectory. We provide reduced images in all available filters for all SpARCS and SPT systems.
- The GOGREEN images are resampled to 3000×3000 pixels with pixel scale 0.200"/pix in the center (∼ 10' on a side). All filters are aligned in x and y.
- The two northern GCLASS-only images are resampled to 5000×5000 pixels with pixel scale 0.185"/pix in the center (∼ 15' on a side).
- The three southern GCLASS-only images are resampled to 3000×3000 pixels with pixel scale 0.185"/pix in the center (∼ 10' on a side).
Note the zero-points of the images vary, and are described in an associated file.
HST images
In directory PHOTOMETRY/IMAGES/HST/
These are treated differently and are available in a separate subdirectory (12GB). Reduced images only are provided. See the data release paper and Chan et al. (2021) for a description.
PHOTOM_CATS
In directory PHOTOMETRY/PHOTOM_CATS/
Ks-band selected catalogs, where each detected object is required to have 5 adjacent pixels with at least 1.5 sigma in the original (unconvolved) Ks-band image. All flux values have an AB magnitude zero-point of 25 (equivalent to a flux scale of 0.3631 uJy per count). Therefore m_filter = -2.5*log10(flux_filter) + 25.
The column totmask is a conservative mask, equal to zero only if good photometric data is available in all filters. Otherwise it is set to 1, and not include in the compilation catalogue Photo.fits. Many of these data will still be useful, to those who don't require access to all filters.
The five GCLASS-only clusters have a slightly different structure to the catalogue. See the README.gclass file provided with the data for details.
PHOTOZ_CATS
In directory PHOTOMETRY/PHOTOZ_CATS/
ID-matched to the main photometric catalogue.
photoz-cats using EAZY code (extension .zout).
- id – same identifier as PHOTOM_CAT
- z_peak – probably best estimate for photo-z
A quadratic function is fit to z_peak(z_spec) for the GOGREEN clusters. This correction has been applied to the redshifts in *_zphot.dat files.
RESTFRAME_COLOURS
In directory PHOTOMETRY/RESTFRAME_COLOURS/
For the GOGREEN clusters we provide SDSS, FUV, NUV, U, B, V, J rest-frame colours estimated with EAZY. For each source, two different set of rest-frame colours are estimated:
- The first set assumes the cluster mean redshift for each source.
- The second set is based on the individually-measured spectroscopic redshifts, or, if there is no spec-z measured, the peak of the posterior P(z).
- Offsets to U-V and V-J colours have been applied to make the quiescent loci match those of UltraVISTA. Corrections are in
UVJcorrections.dat.
The five GCLASS-only clusters have only U-V and V-J colours provided, in a differently formatted file.
SPECZ_MATCHED
In directory PHOTOMETRY/SPECZ_MATCHED/
ID-matched to the main photometric catalogue. Simple shifts are applied to bring the spectroscopic catalogue to the same astrometric reference as photometric catalogue prior to matching. Matching was done within 1.0", with priority:
- GOGREEN
- GCLASS
- SPT
- FORS2 (SpARCS-0335)
- VIPERS
- PRIMUS
- SDSS
- NED general search for spectroscopic redshifts
When there are two (or more) matches to spectroscopic catalogues, the second match is also reported (following the same priority list). To help cross-matching with GOGREEN spectra, the spectroscopic GOGREEN ID is reported in the last column.
STELMASS_CATS
In directory PHOTOMETRY/STELMASS_CATS/
ID-matched to the main photometric catalogue. Stellar masses and other SED-fitting parameters from FAST. There are two versions:
*Ks.fouttakes the z_peak from the photo-z catalogue, or the spectroscopic redshift when available.*Ks_fixz.foutfixes the redshift of all objects to the cluster mean redshift. This may come in handy when performing a statistical background subtraction.
All relevant parameters for the grid of template models are listed in the header of the files.
BESTFIT_SEDs
In directory PHOTOMETRY/BESTFIT_SEDs/
Best-fitting SED models to the photometry based on the BC03 library and the best spectroscopic redshift for each source. Includes the aperture correction to MAG_AUTO.
COLORIMS
In directory PHOTOMETRY/COLORIMS/
RGB colour images of the clusters, constructed from B, I, and Ks images. Spectroscopic targets are indicated, using a very simple division between green (within 0.01 of mean cluster redshift) and red (rest).
COSMOS
In directory PHOTOMETRY/COSMOS/
We provide the DR1 Ultravista catalogue v4.1 here, for convenience. We use this as the source of photometry for the relevant GOGREEN systems.
The catalogue was obtained from https://www.strw.leidenuniv.nl/galaxyevolution/ULTRAVISTA/Ultravista/UltraVISTA_Catalog_Home.html.
If you use this catalog in your research directly, or if you use the photometric information associated with the COSMOS groups or field sample in GOGREEN, please acknowledge it by citing the catalog paper, Muzzin et al. (2013), ApJS, 206, 8.
SXDF
In directory PHOTOMETRY/SXDF/
We use the SPLASH v1.6 catalogue as the source of photometry for the GOGREEN systems in the SXDF field. The catalogue can be obtained from http://splash.caltech.edu/public/catalogs.html#sxds.
If you use this catalog in your research directly, or if you use the photometric information associated with the SXDF groups or field sample in GOGREEN, please acknowledge it by citing the catalog paper, Mehta et al. (2018).
In this directory we provide a .csv file with a subset of columns and restframe UVJ colours computed consistently with the rest of our sample.
Related Surveys & Collaborations
Contact Us
- Michael Balogh (GOGREEN survey): mbalogh [at] uwaterloo [dot] ca
- Robert Nikutta (Data Lab): robert [dot] nikutta [at] noirlab [dot] edu