Section author: Robert Nikutta <robert.nikutta@noirlab.edu>
Version: 20210105
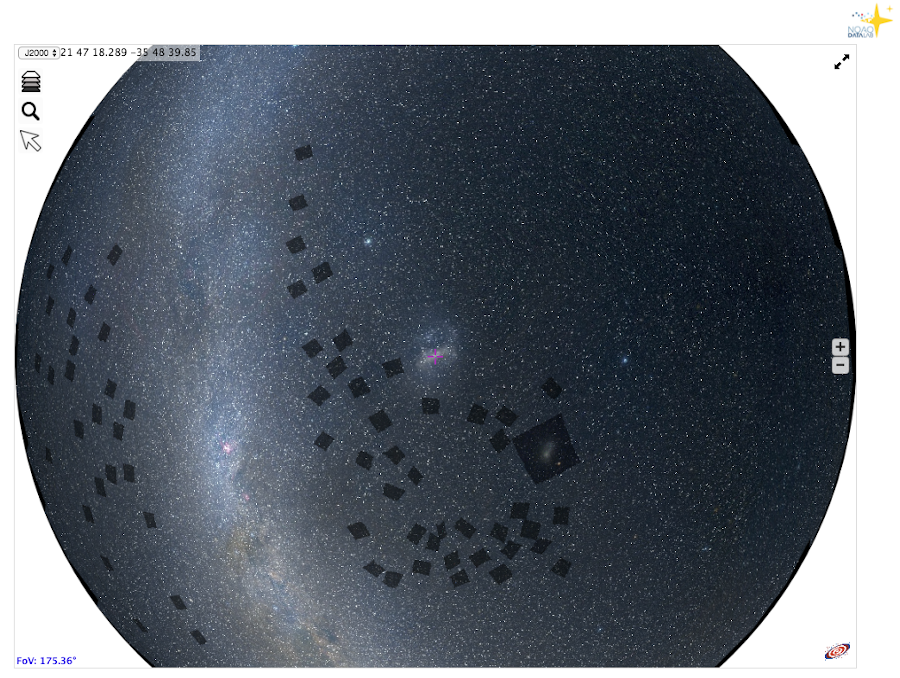
1.4.2. Data Discovery tools
There are currently two kinds of Data Discovery tools used by the Data Lab, an Image Discovery Tool and a Catalog Discovery Tool, described below. Both are based on Aladin Lite, which is maintained by the Centre de Données astronomiques de Strasbourg (CDS).
1.4.2.1. Image Discovery Tool
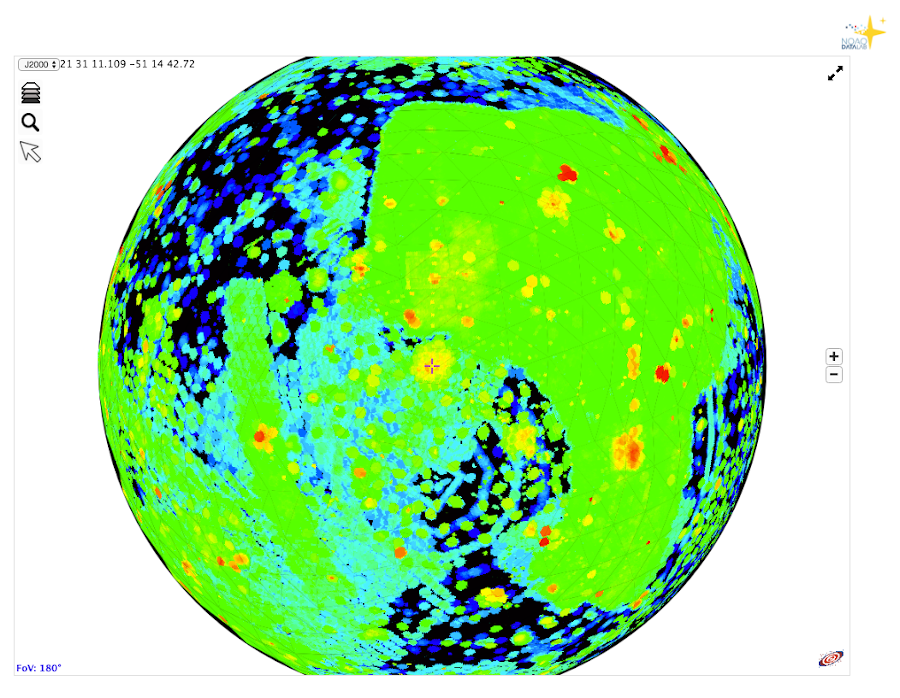
Launching the Image Discovery Tool presents you with a view of the NOIRLab exposure map, wherein every pixel in the map contains the log total exposure time from NOIRLab DECam and Mosaic (1, 1.1, 2, and 3) images. The globe is interactive, and can be spun by clicking on it and dragging the mouse. The ‘+’ and ‘-’ buttons or the mouse wheel may be used to zoom the view in and out. The display at upper left shows the coordinates of the center of the view, by default on the J2000 celestial coordinate system. The drop-down menu can be changed to output Galactic coordinates instead.
There are three buttons at upper left. The middle button with the ‘hourglass’ icon brings up a dialog that allows the user to enter an object name or coordinate, to center the view on that location.
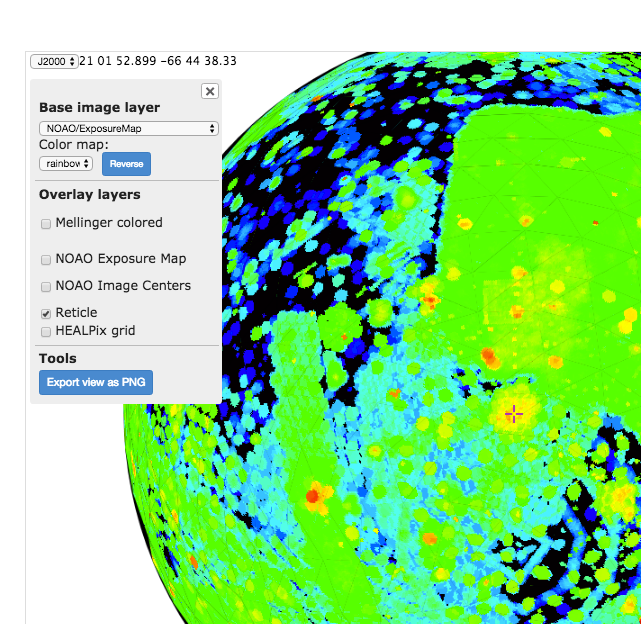
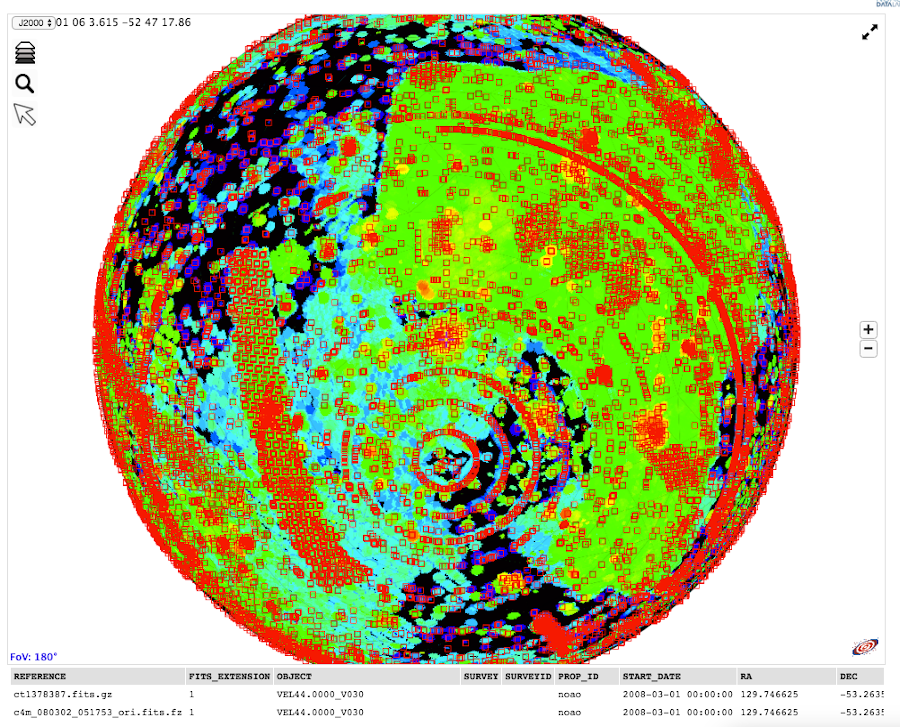
The top button with the ‘stack’ icon controls the layers that are displayed. Clicking on the button brings up a menu with a number of options. At the bottom, there is a button to export the current view as a PNG file. The top part of the menu controls the base layer selection, by default set to the NOIRLab exposure map, and the color map. The middle part of the menu controls the overlay layers, for which there are three options beyond the default Reticle and Healpix grid provided by Aladin Lite: 1) the Mellinger Colored survey, 2) the NOIRLab exposure map (for overlay on alternate base layers), and 3) the catalog of NOIRLab image centers. Clicking on either of the first two options brings up a slider that allows the user to control the opacity of the overlay layer. Clicking on the image center catalog overplots the centers of the images as red boxes on the map. At any zoom level, the number of image centers actually displayed is a roughly fixed number, because the catalog is displayed as a HiPS layer. Thus, to see all image centers in a small area of sky, one should zoom in until they appear.
Activating the display of the NOIRLab image center catalog has the knock-on effect of activating the third button with the ‘arrow’ icon. If the image center catalog is displayed and the arrow button is pressed, then clicking and dragging the mouse on the sky display switches from panning the sky to dragging a box across a set of image centers. After a box has been dragged, information on those image centers will be display in a table below the sky viewer window.
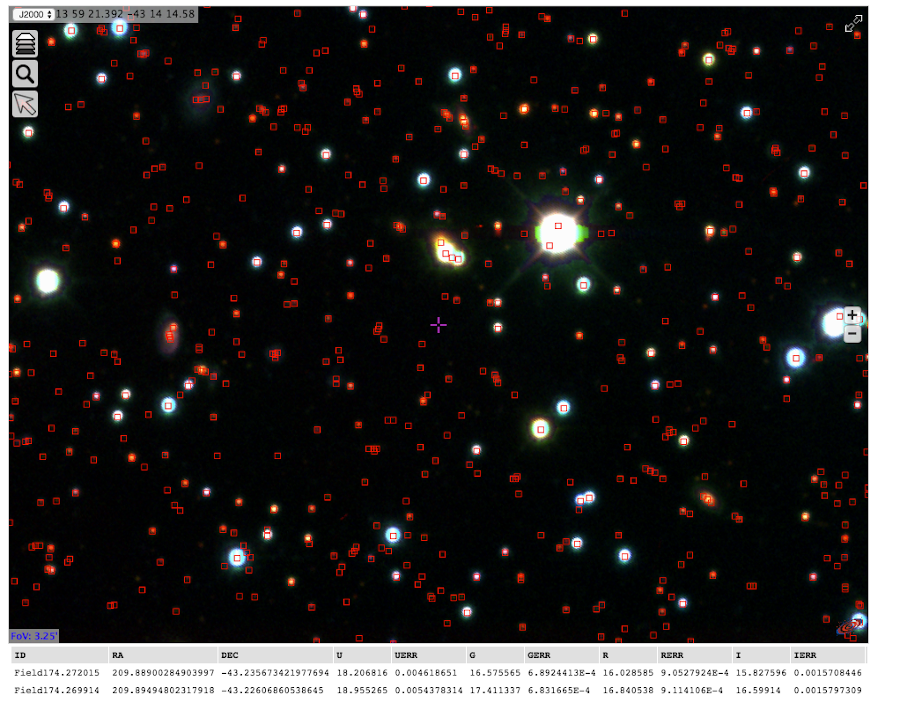
1.4.2.2. Catalog Discovery Tool
Interactions with the Catalog Discovery Tool are nearly identical to those of the Image Discovery Tool. The globe may be panned and zoomed in the same way, the base layer may be adjusted, and overlay layers may be added. The differences are in the available overlay layers. Upon launch, the tool is pre-loaded with the Mellinger Colored image as the background layer and the SMASH image layer as an overlay layer. The user may use the slider to adjust the opacity of the SMASH layer.
Clicking on the SMASH catalog overplots the SMASH catalog objects as red boxes on the map. As with the Image Center catalog, the SMASH catalog is stored in the hierarchical HiPS format. Only the brightest catalog objects are displayed at the lower zoom levels. Thus, to view faint catalog objects, the user must zoom in. Clicking on the ‘arrow’ icon after overplotting the SMASH catalog allows the user to drag the mouse across a set of objects to see their catalog measurements in a table at the bottom of the screen.