Section author: Robert Nikutta <robert.nikutta@noirlab.edu>, Alice Jacques <alice.jacques@noirlab.edu>
Version: 20211119
1.4.3. Web query interface
The web Query Interface Tool provides four basic features:
a way to browse the catalog tables, their schema, and their column descriptions (all users)
a way to query the tables and return the results to the browser (all users) or to your MyDB or virtual storage space (registered users only)
a way to check the job status of a user’s latest queries (registered users only)
a way to view and download the contents of a user’s Virtual Storage space (registered users only)
1.4.3.1. Browsing tables
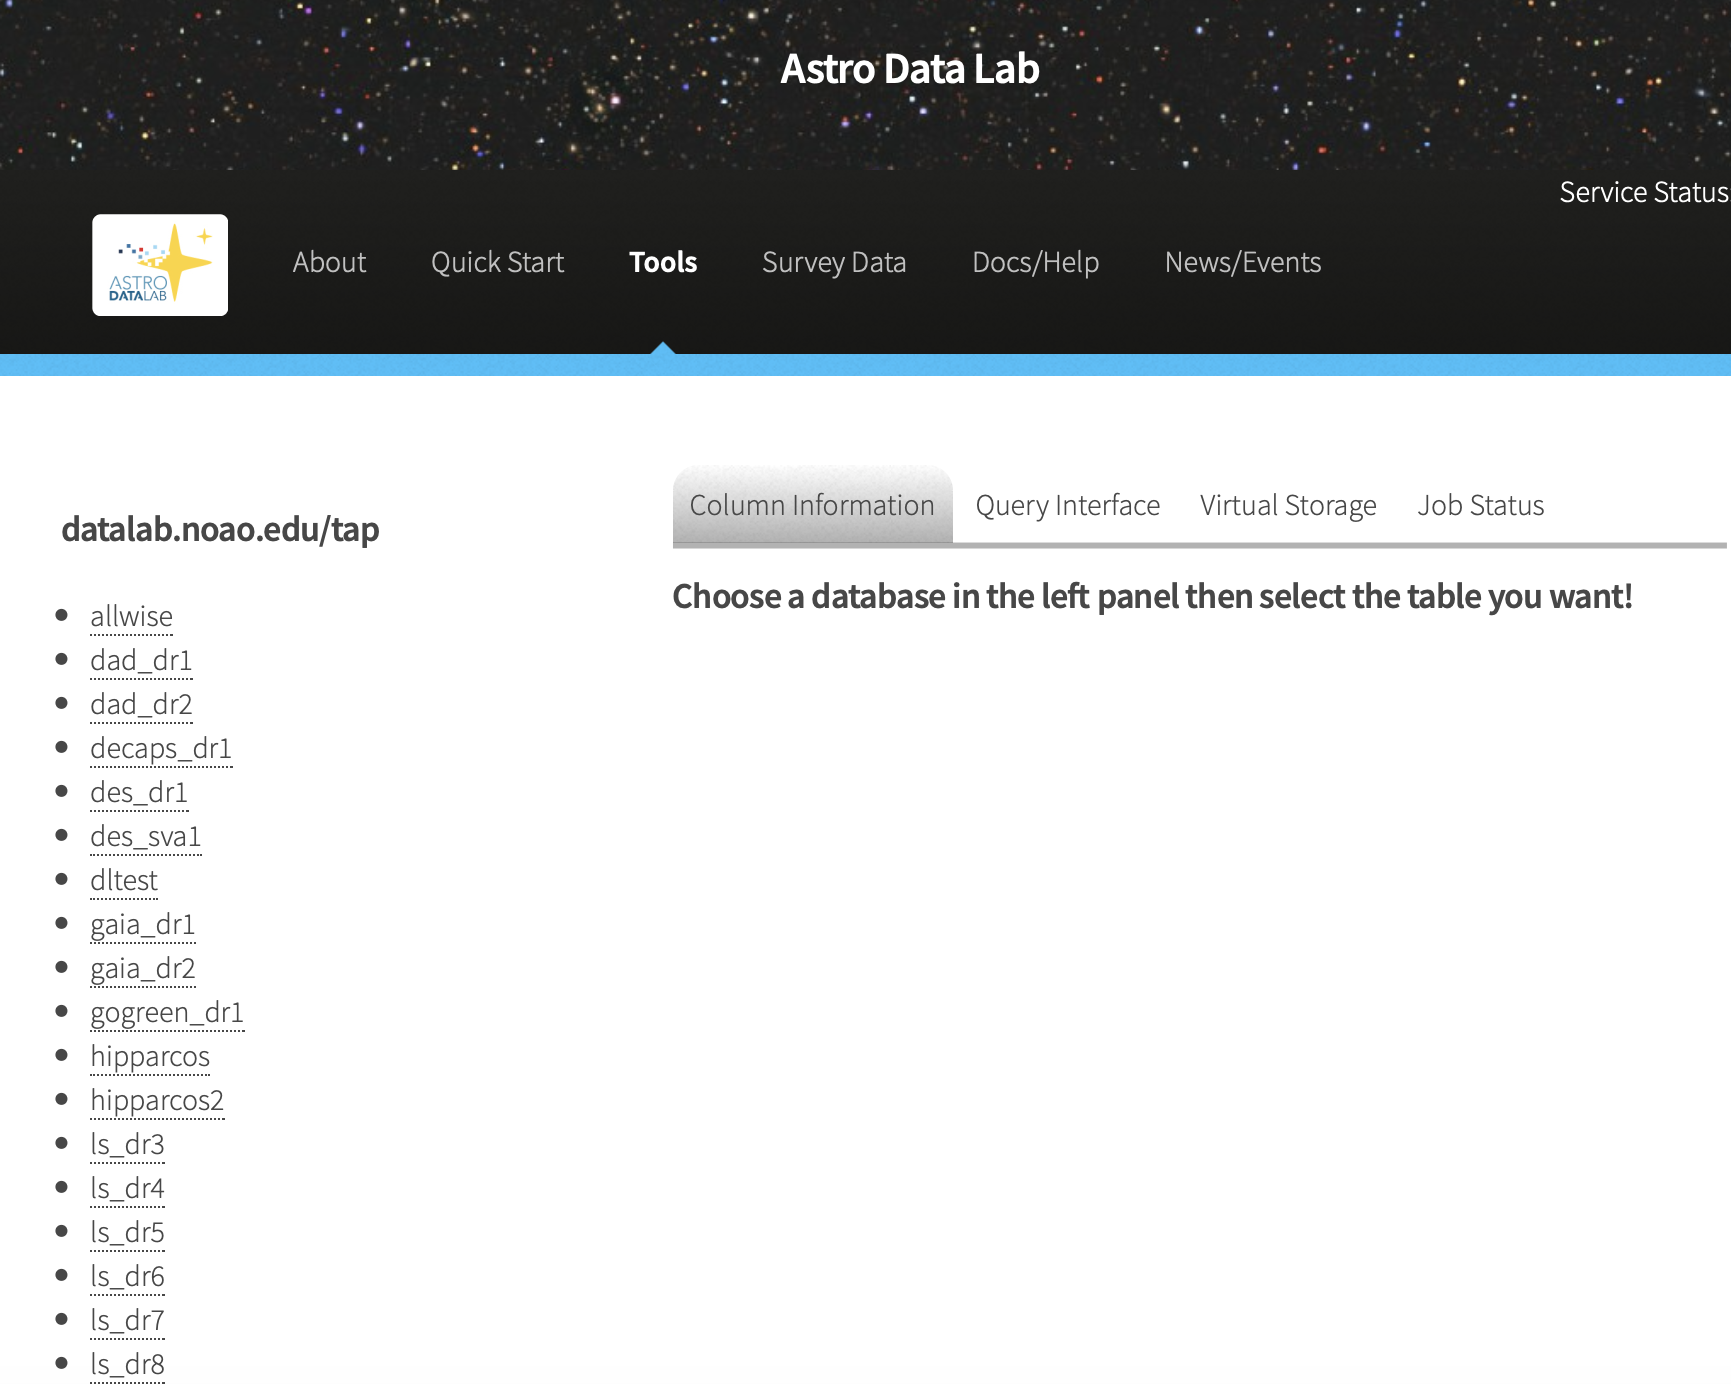
When the Query Interface Tool is launched, you are presented with the following view, which shows a list of the survey datasets available through the Data Lab TAP service:
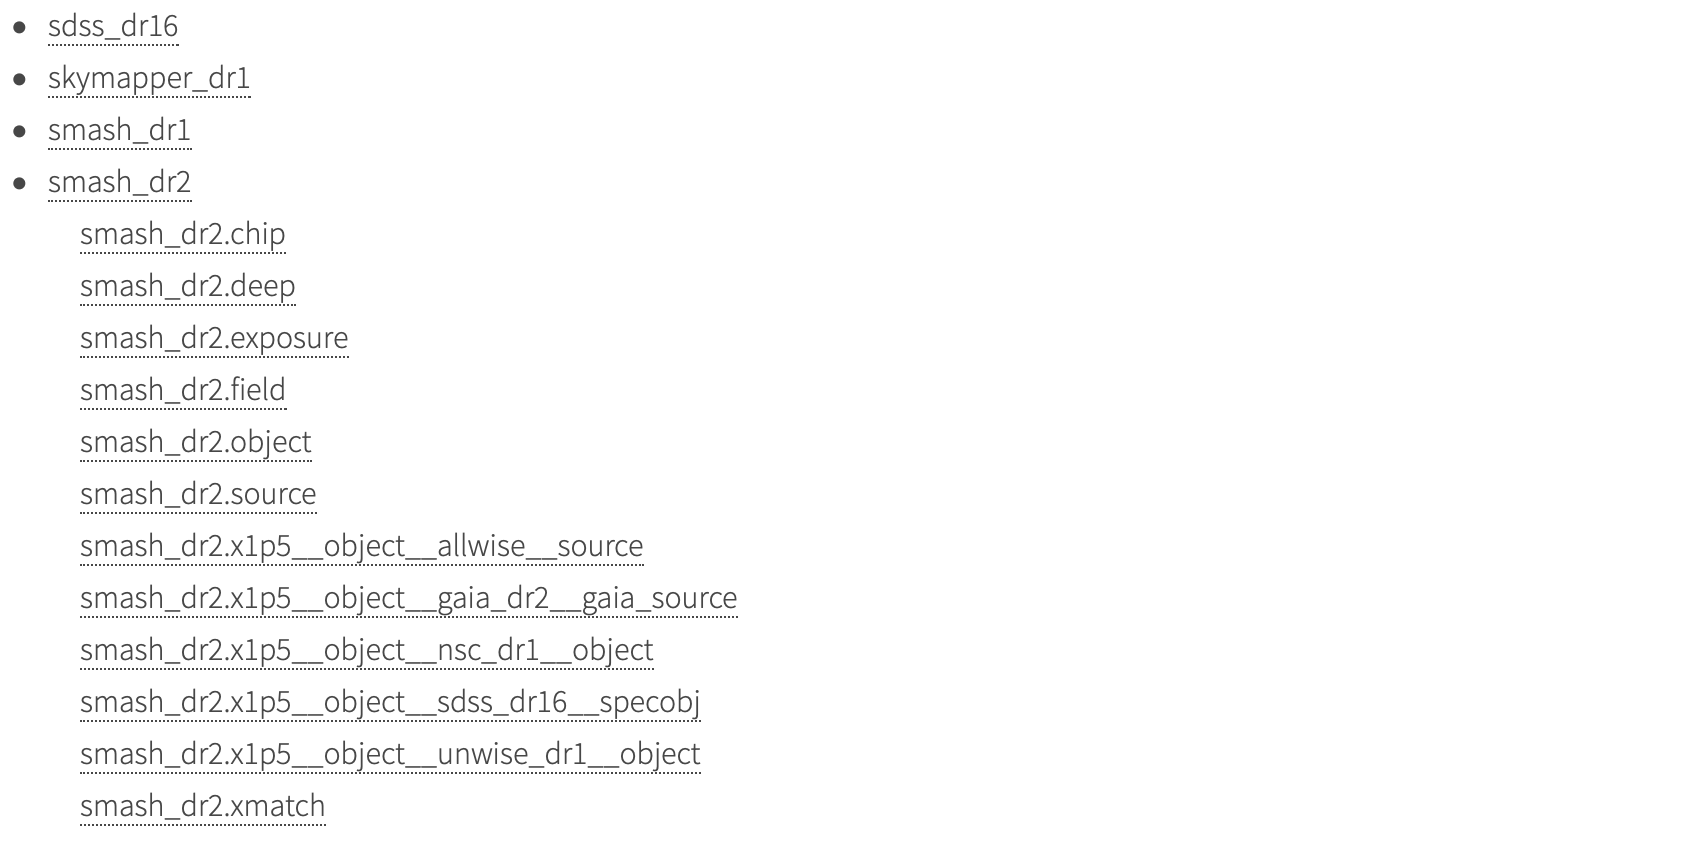
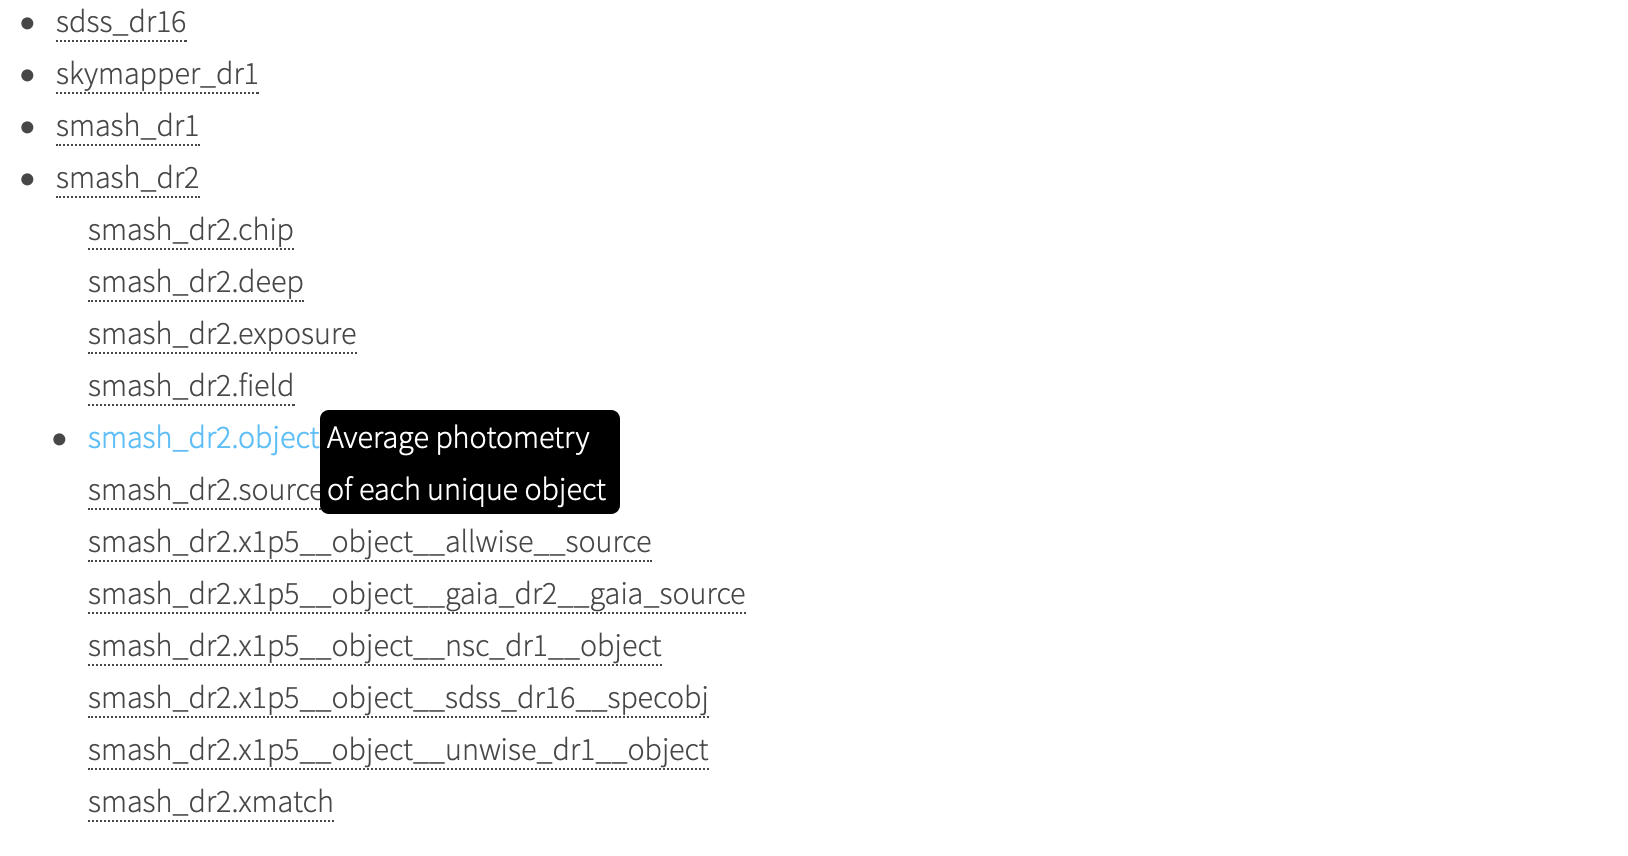
Clicking on a survey brings up a list of the tables contained within it. In the following view, we have clicked on smash_dr2, and are shown the seven tables available as part of the SMASH DR2 survey as well as five crossmatch tables produced by Astro Data Lab. (For basic information on the surveys and how their tables are organized, see the section on Survey Datasets).
If you hover over the tables with your mouse, you will get a popup that contains a short description of what that table contains. In the figure below, we have hovered over the smash_dr2.object table.
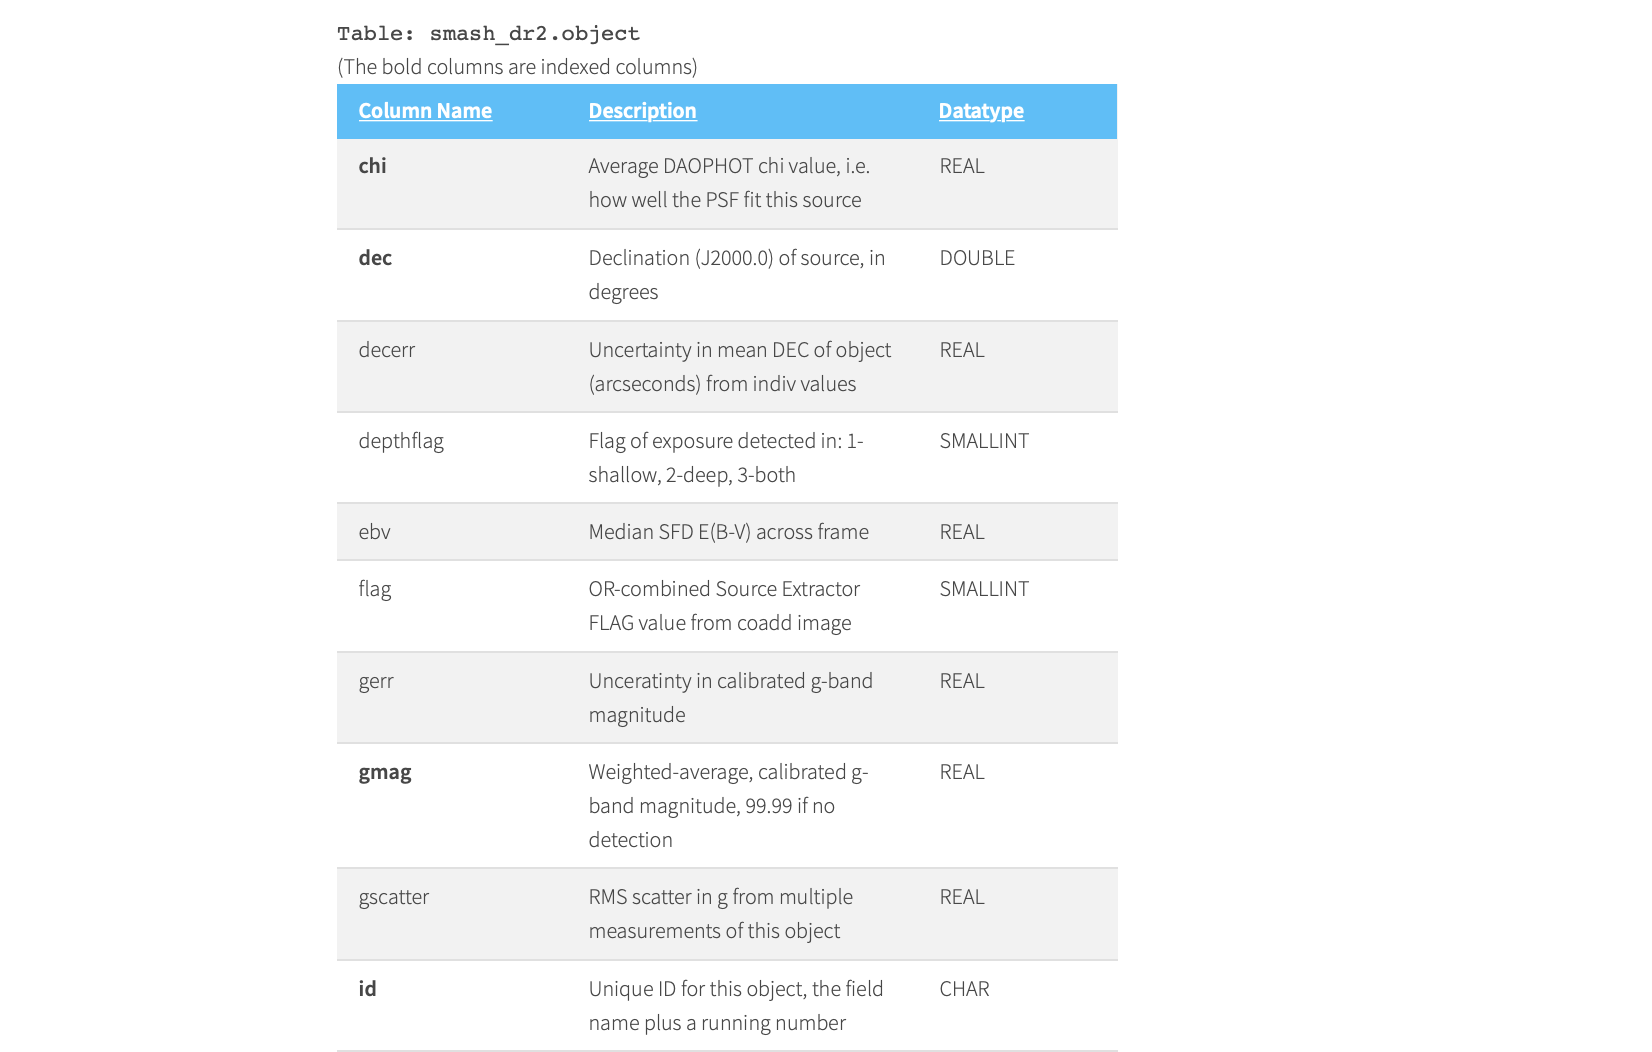
Clicking on a table name brings up a view of the columns that it contains, the column descriptions, and the data type of the column. Column names listed in bold are indexed in the database, while column names in normal type are not. For more on what indices do for you, see the section on Optimizing queries. The screen snap below shows the descriptions of the first 10 (alphabetically) of the 32 columns in smash_dr2.object.
1.4.3.2. Querying tables
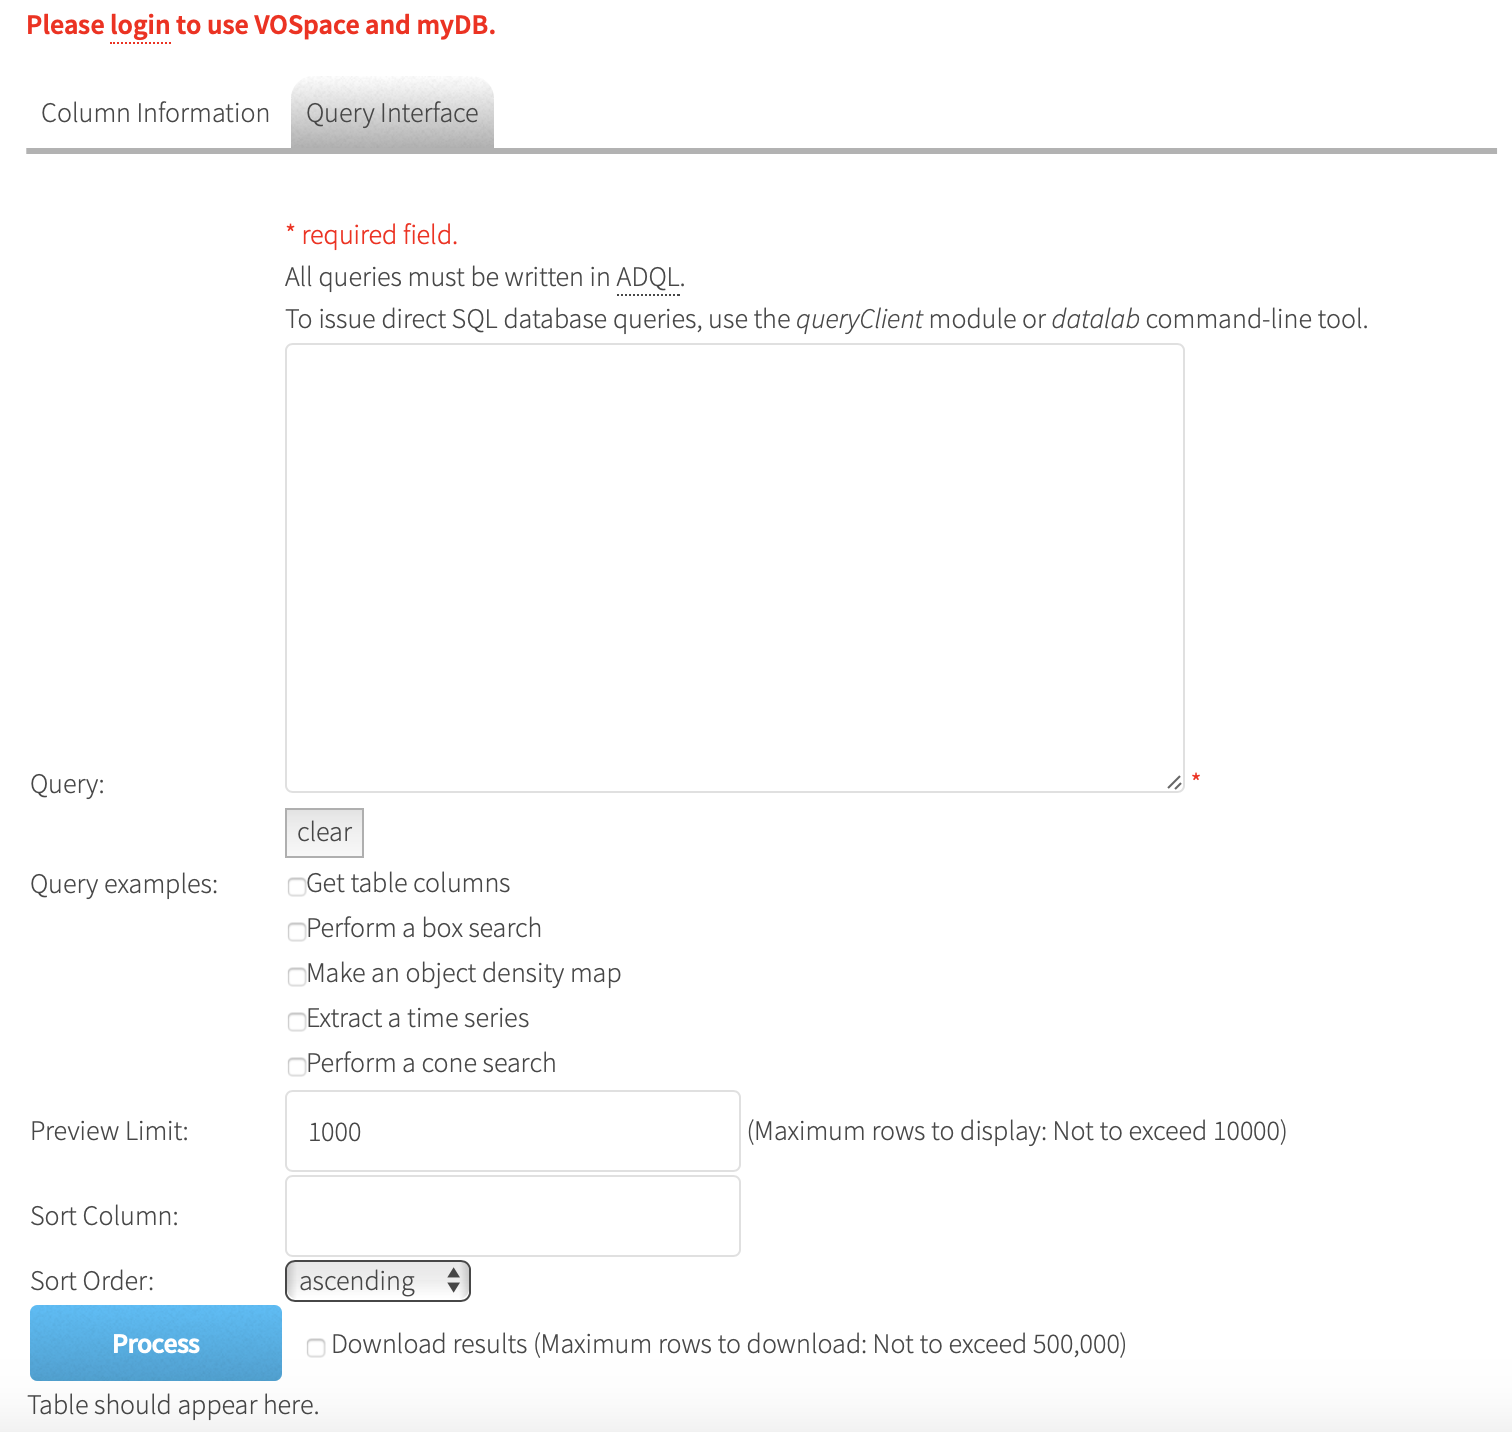
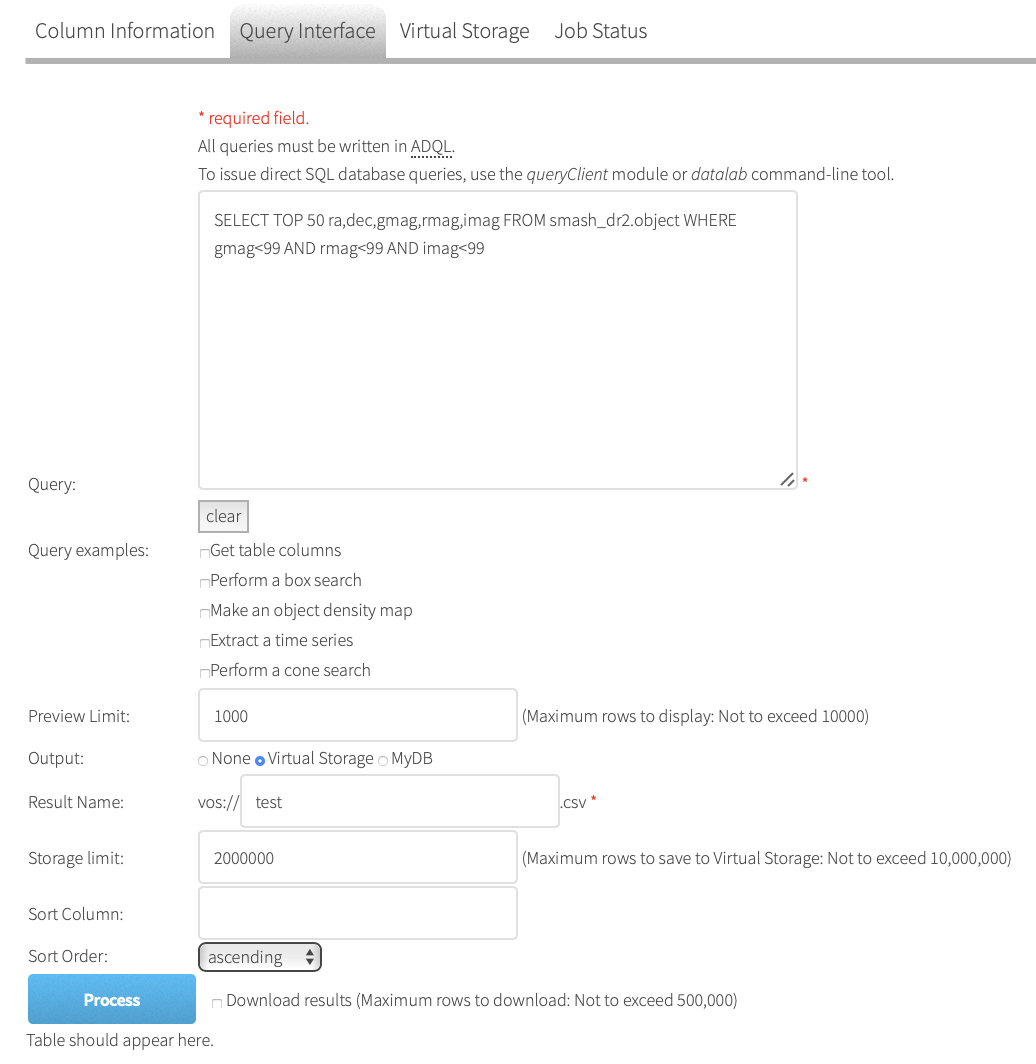
Clicking on the Query Interface button allows you to make a query of one of the database tables by entering an ADQL statement in the text box. Below is the view you will see if you are an anonymous (not logged in) user. The Preview Limit column sets a limit on the number of rows that will be displayed in the browser, but does not place a limit on the query itself. You thus need to be careful with the number of rows that your query will return.
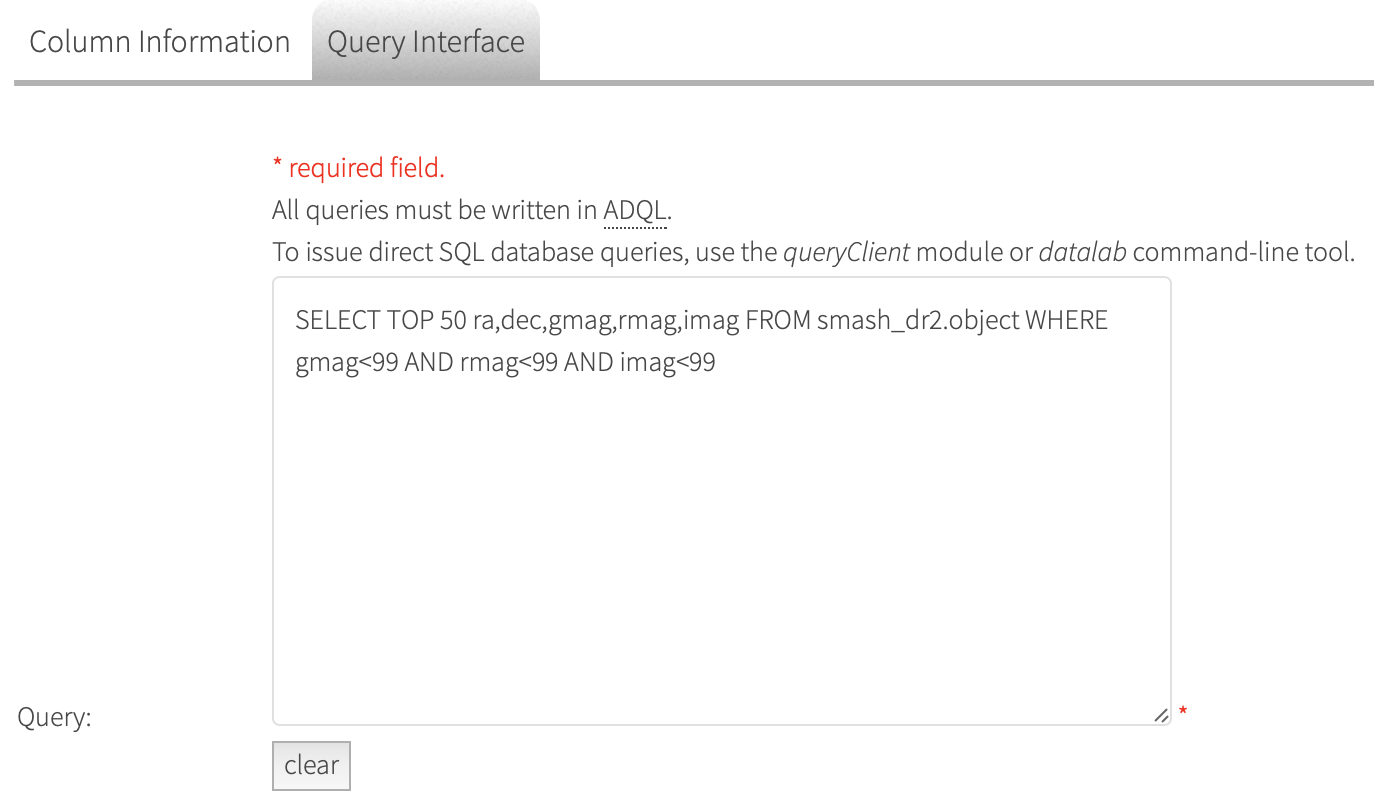
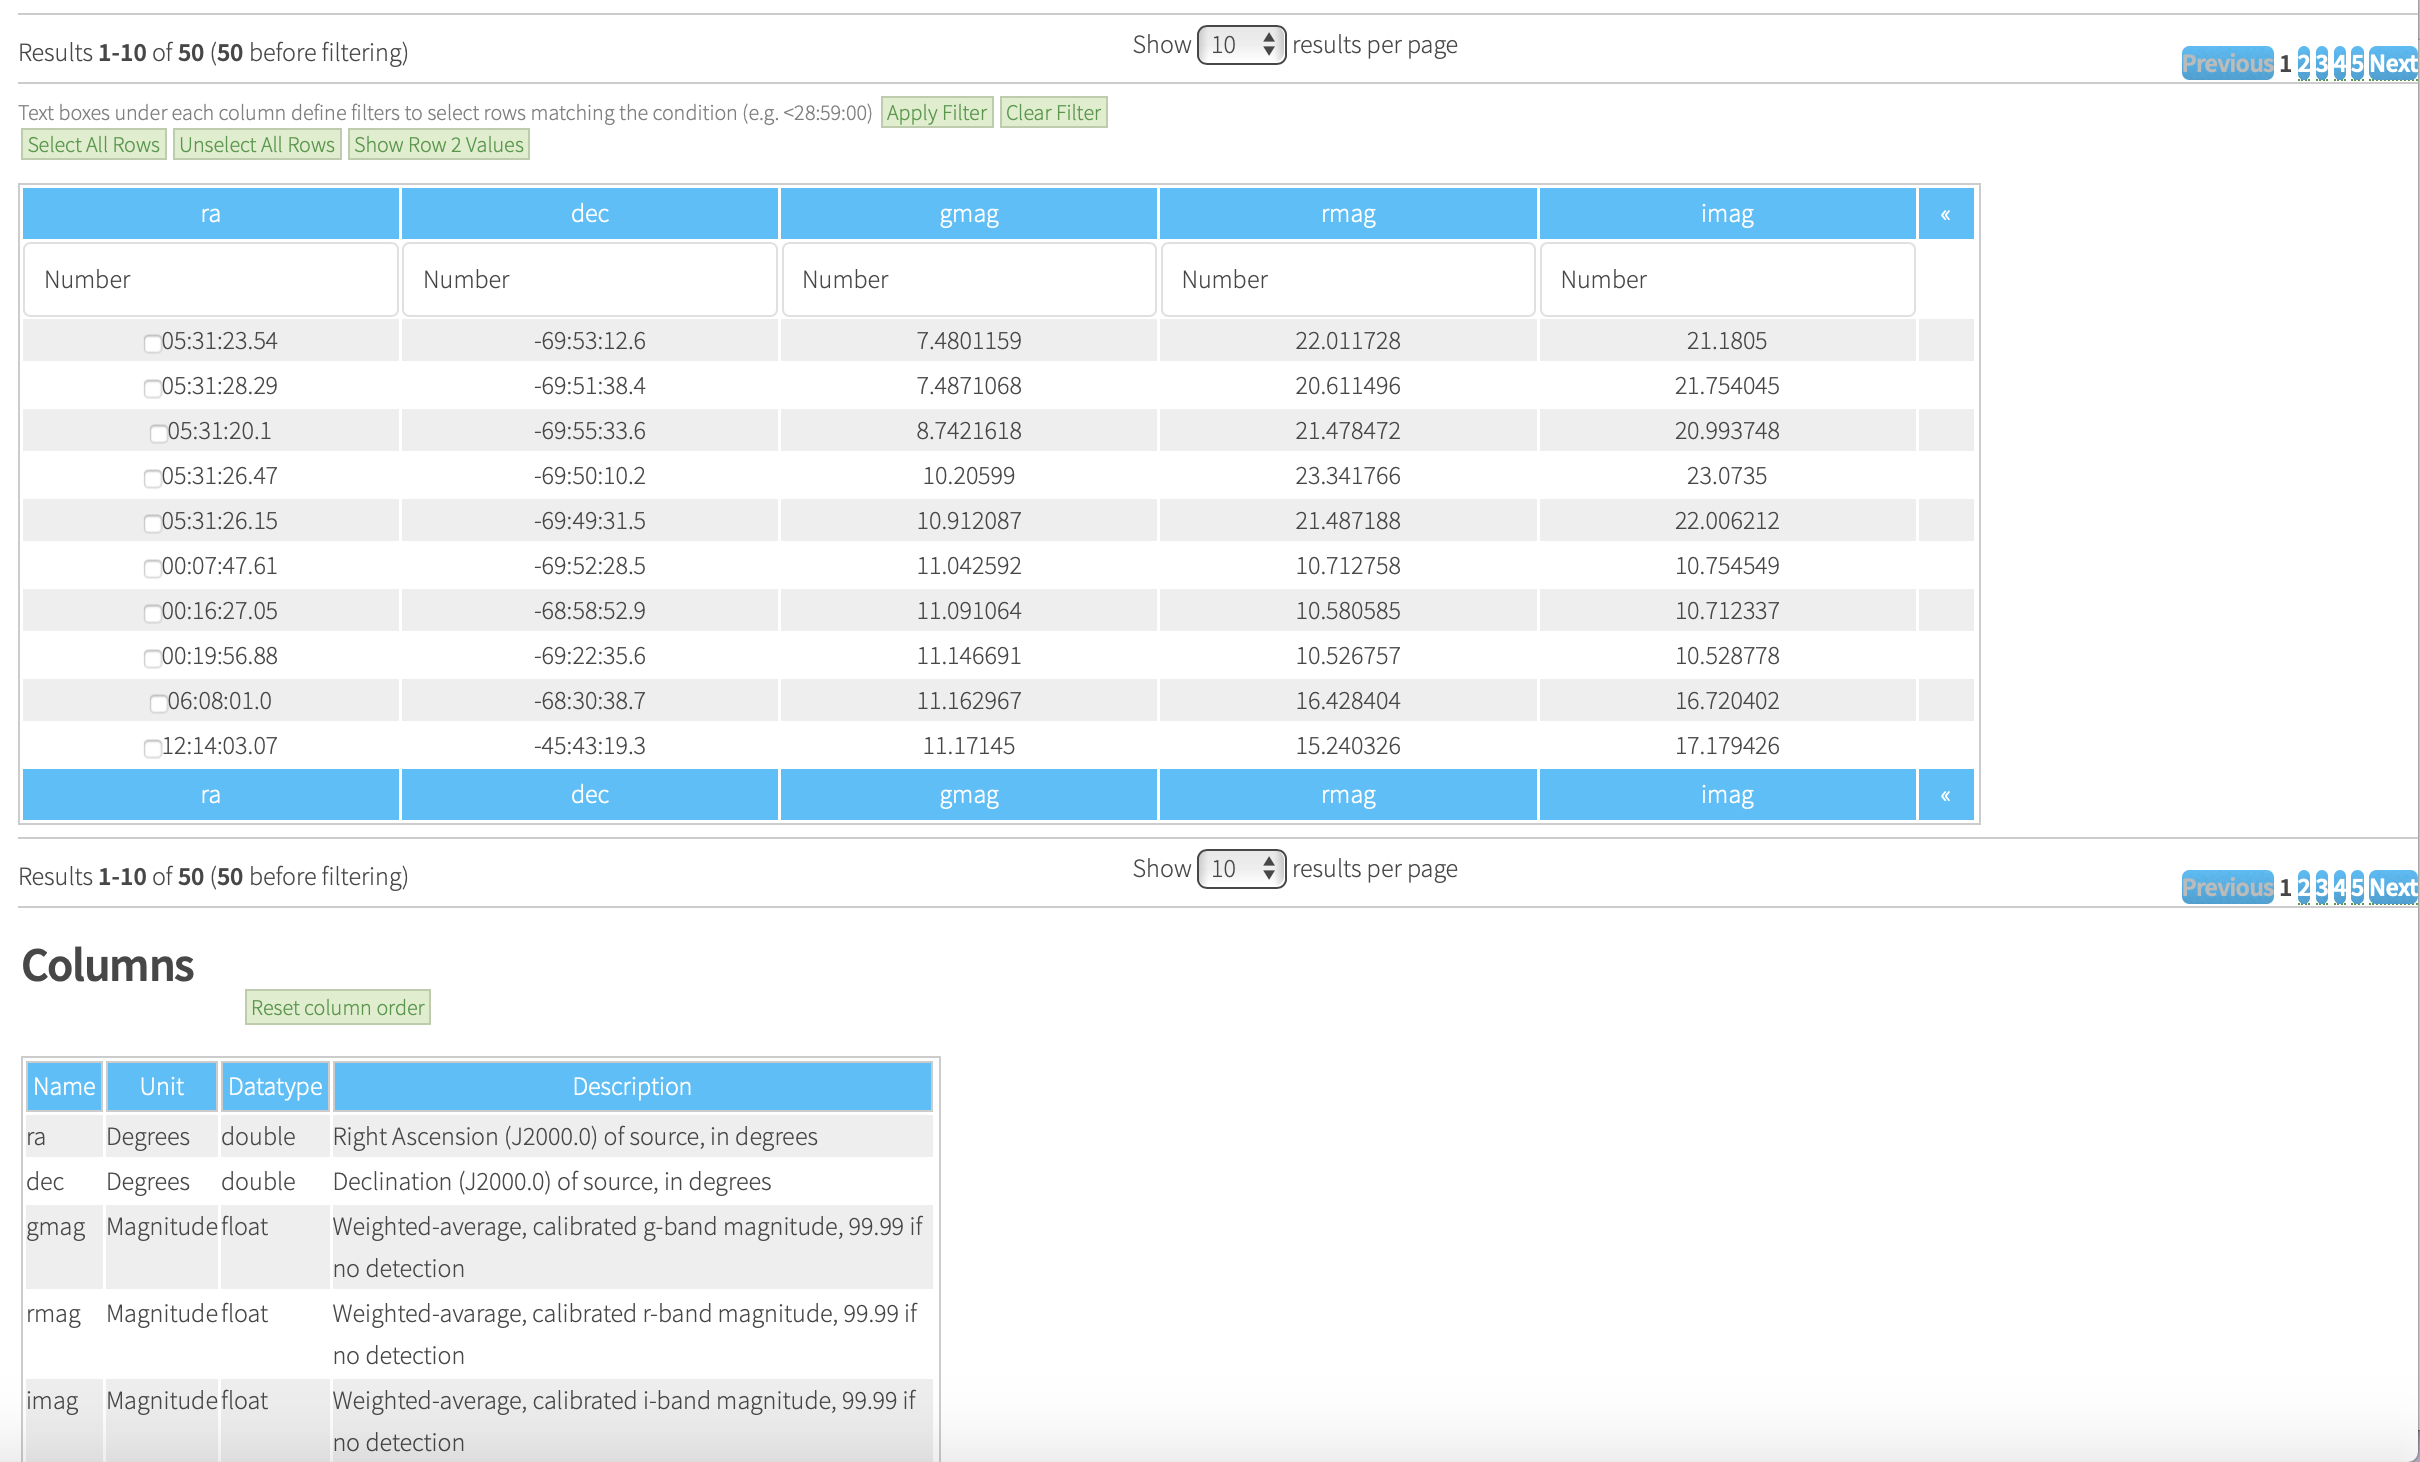
In the following, we have made a query of the smash_dr2.object table that will retrieve the ra, dec, gmag, rmag, and imag from the first 50 rows of the table where gmag, rmag, and imag are less than 99 (a value of 99.99 means no detection), and have hit the Process button. Note that the “TOP 50” statement in ADQL is equivalent to “LIMIT 50” in SQL.
The results are shown in the table below the query form, along with a table that shows the column descriptions. There are buttons to scroll through the columns as well as buttons to move through pages of rows. The results table can be filtered by applying arithmetic constraints in the text box above any of the columns and clicking Apply Filter (you can remove the filter with the Clear Filter button). You can change the order of the rows displayed by dragging the column names in the Column description table.
If you log in to the Data Lab, the Query Interface offers the option to store the results in Virtual Storage or as a table in MyDB. If you pick one of these options, you will be prompted to enter the name of the result, which will be a CSV file if saved to Virtual Storage or a table name if saved to MyDB. The result will also still be displayed to the browser, with the limit of the number of displayed rows set by the Preview Limit. The Storage Limit is applied to the query itself, and thus acts like a TOP (or LIMIT) statement in ADQL (SQL).
1.4.3.3. Job Status
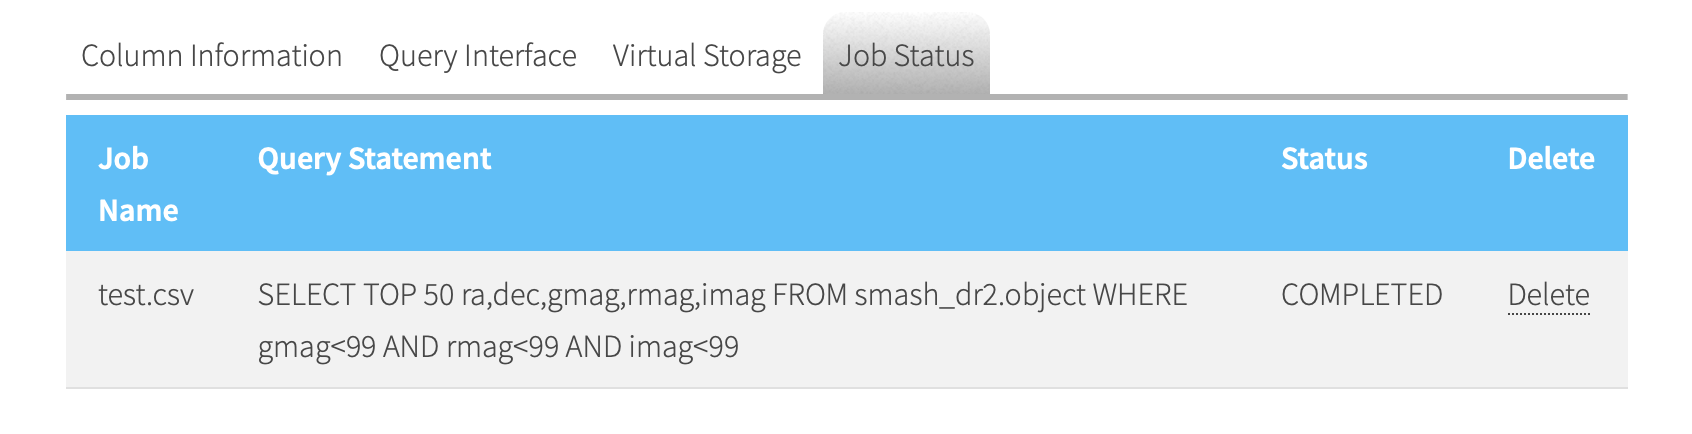
After clicking Process, the query is executed and the file (Virtual Storage) or table (MyDB) is created. A message to this effect will appear on the screen, along with the results shown in the browser. You can check the status of your query by clicking on the Job Status tab.
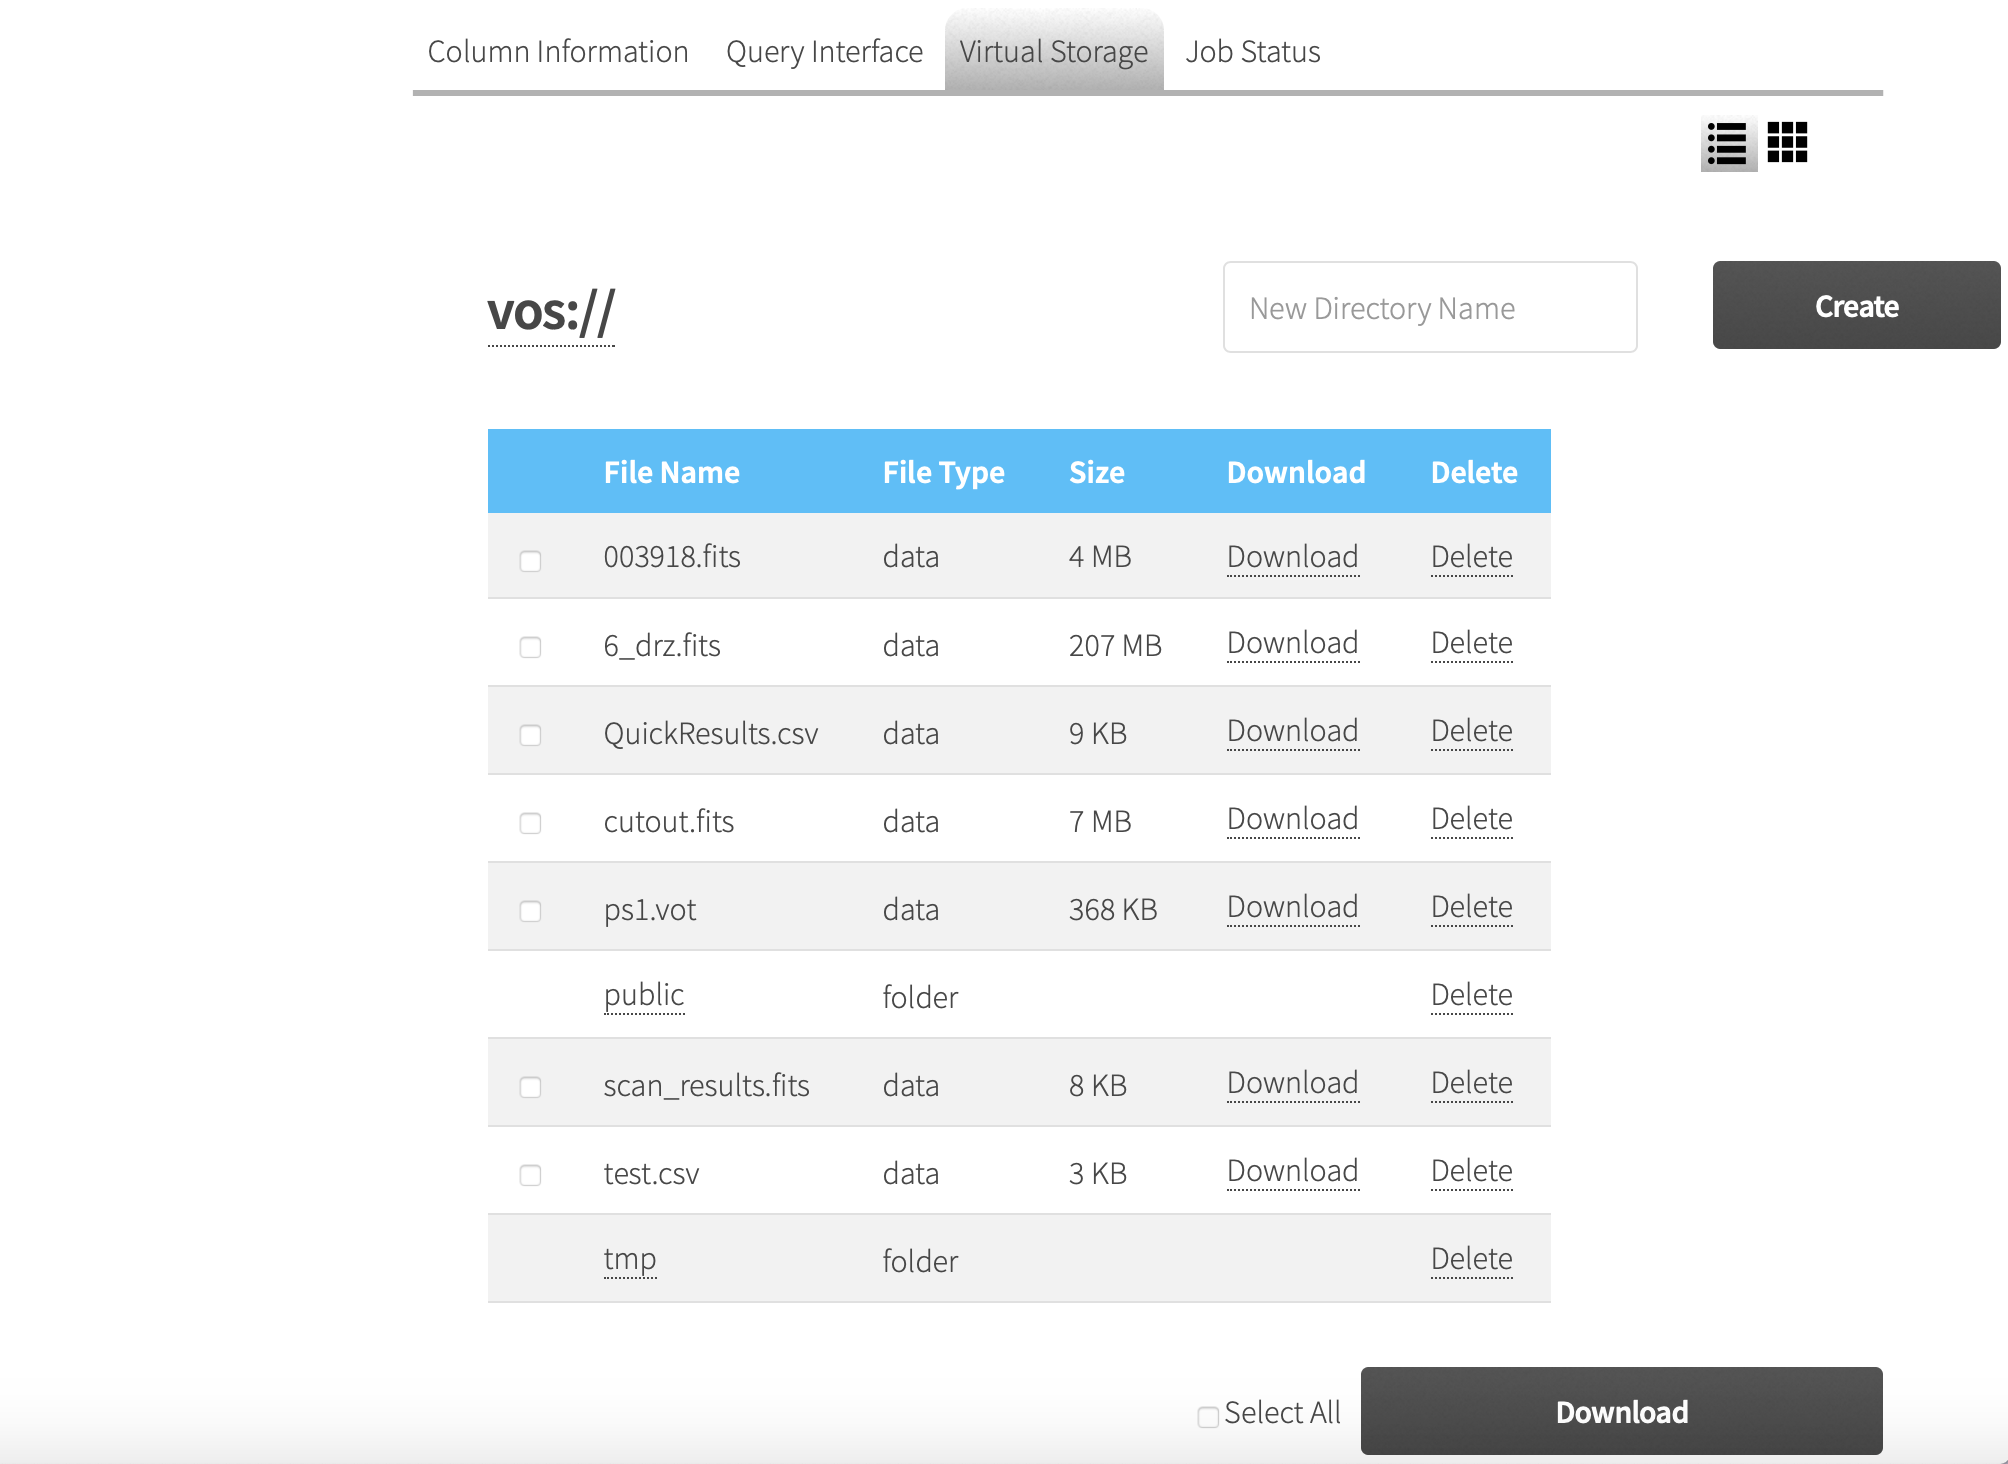
1.4.3.4. Virtual Storage
If you are logged in, you will also see a Virtual Storage tab that allows you to view the file name, file type, and file size of each file in your Virtual Storage space along with the ability to download or delete any of the files. To access a Virtual Storage file or a MyDB table you will need to use one of the other Data Lab clients, such as the datalab command or through a Jupyter notebook.