Section author: Alice Jacques <alice.jacques@noirlab.edu>, Robert Nikutta <robert.nikutta@noirlab.edu>
Version: 20211119
1.3.4. Crossmatch Tool
The Data Lab crossmatch tool (X-match Service) allows users to upload their own data tables (with columns for RA and Dec positions), and to efficiently crossmatch them with the tables in Data Lab. The service requires that the user be logged in, because uploading tables to the user’s VOSpace or MyDB database necessitates authentication.
Go to the X-match Service: https://datalab.noirlab.edu/xmatch.php
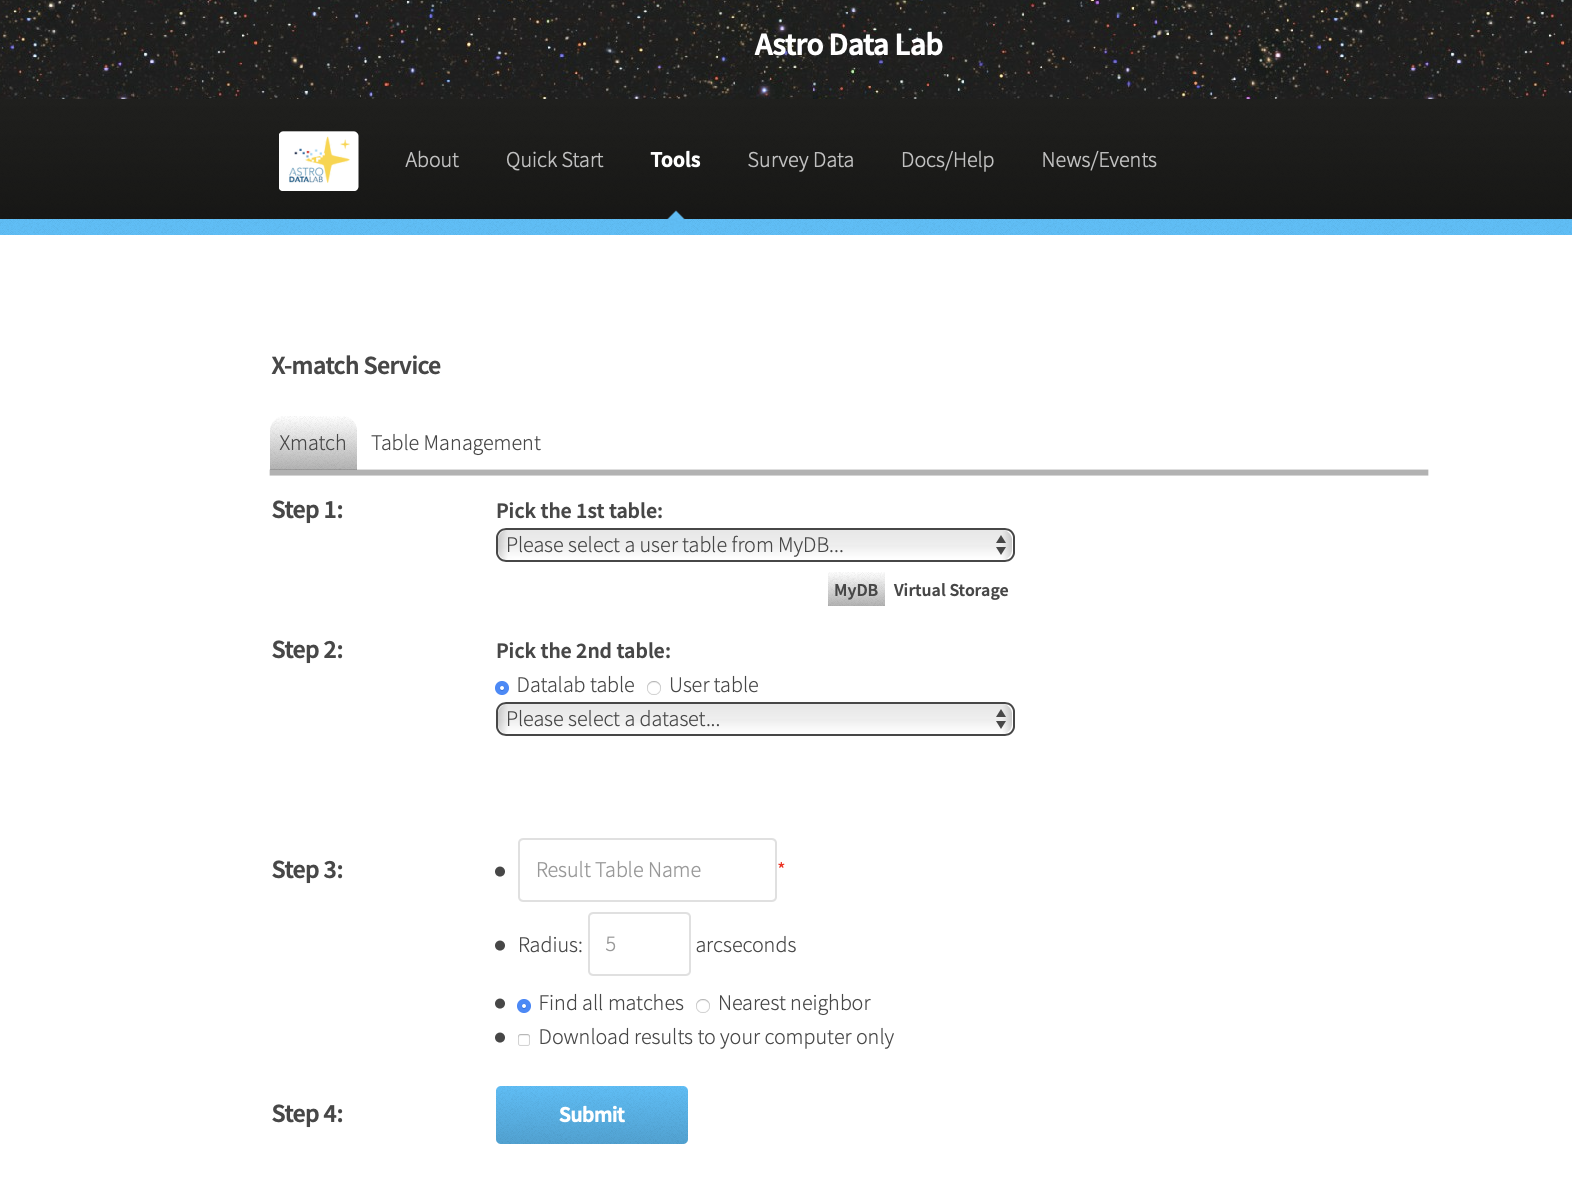
When the X-match Service is launched, you are presented with the following view, which shows how to use the X-match Service in 4 steps: pick the 1st table, pick the 2nd table, name the result table and set specifications (search radius size in arcsec, all matches or nearest neighbor, save locally or save to your Virtual Storage), and submit.
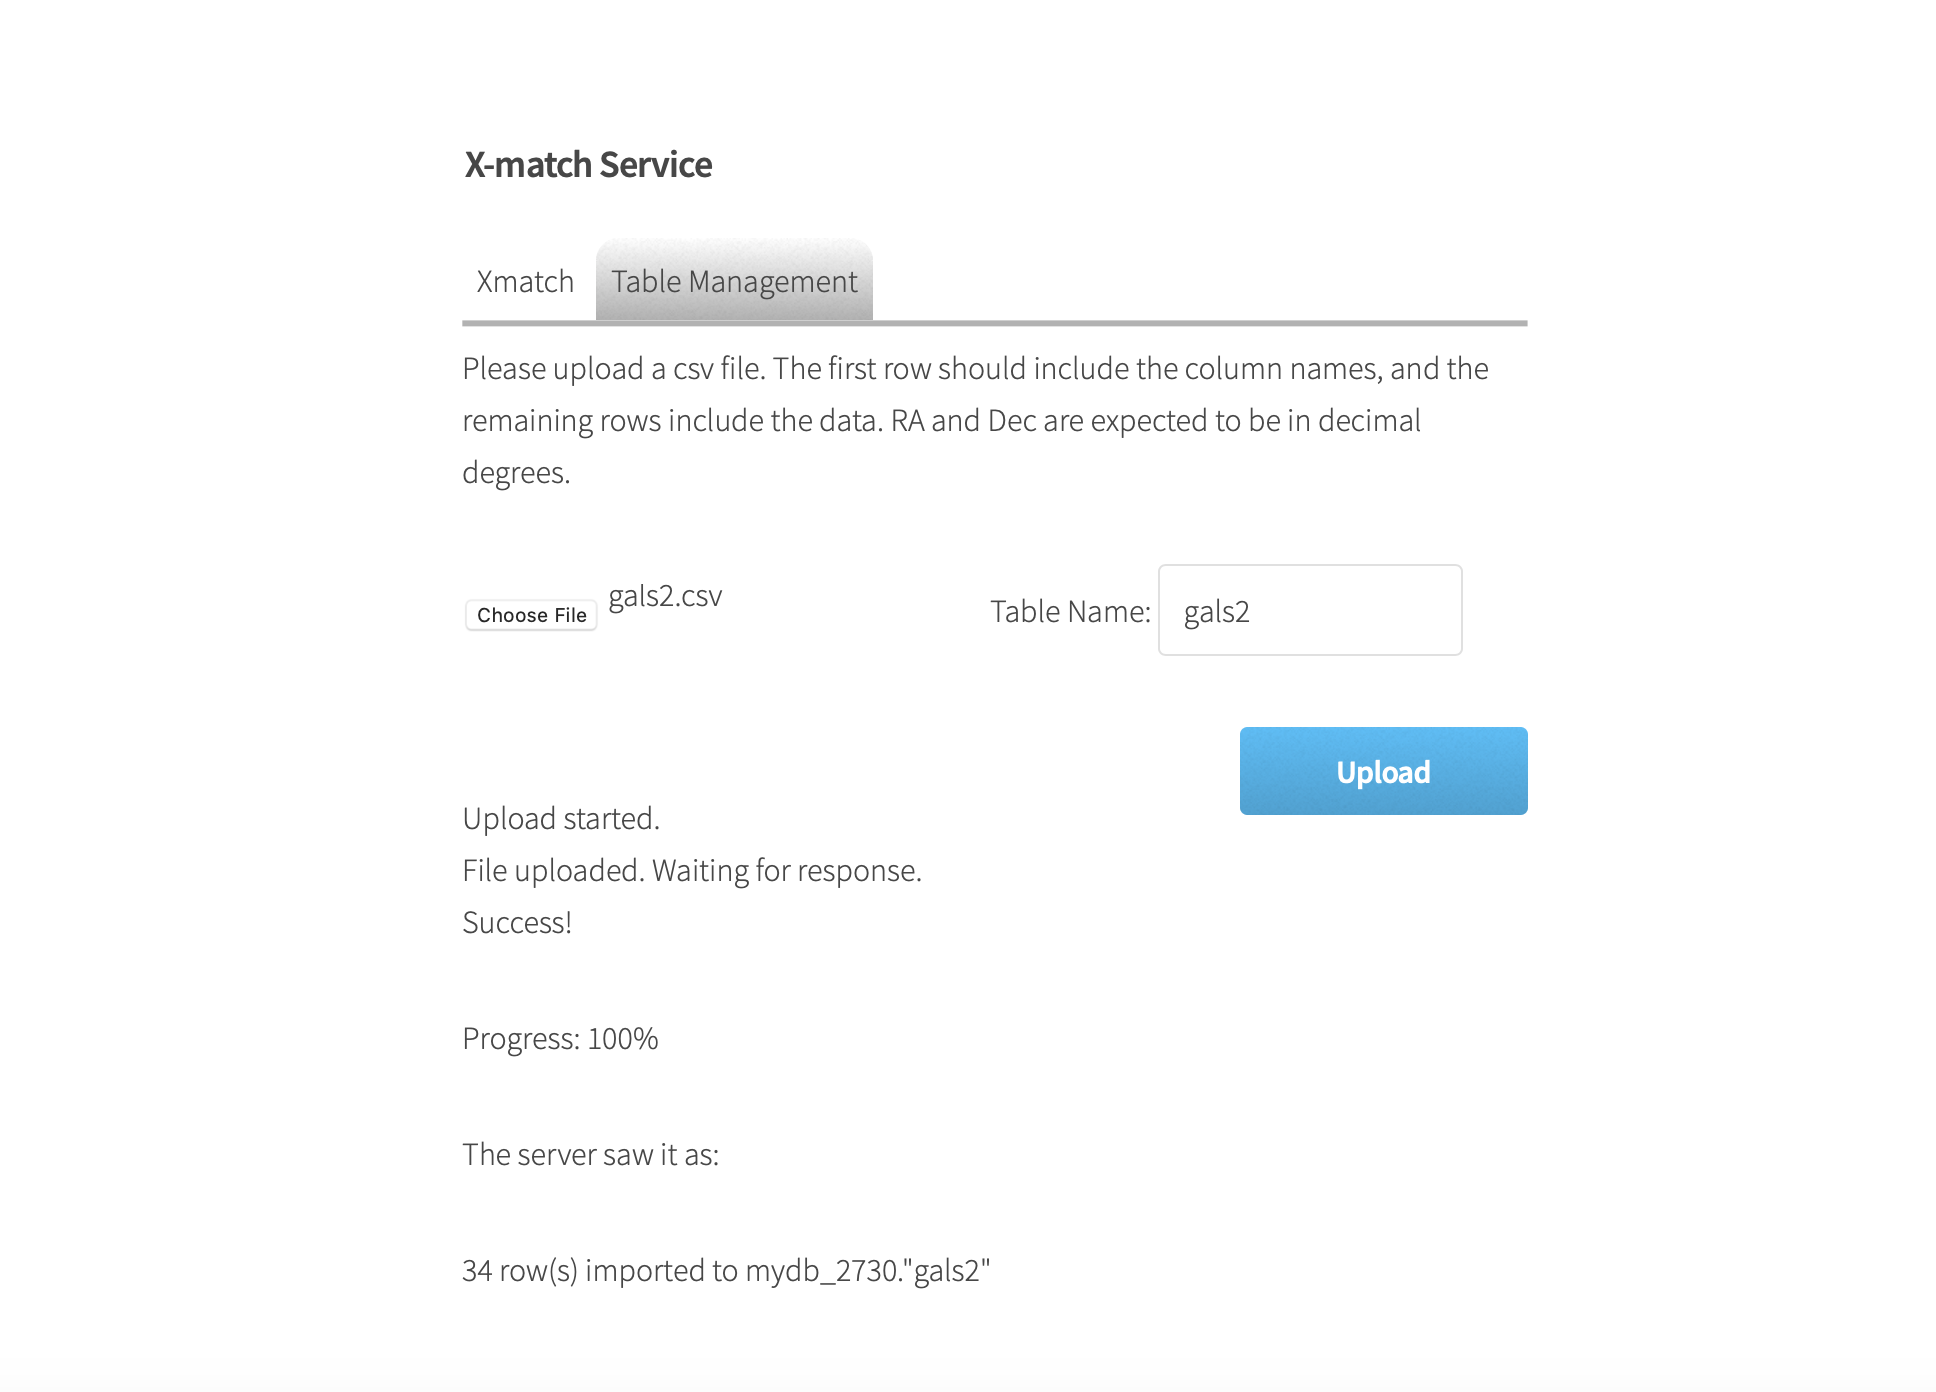
The 1st step is to pick the 1st table, which may be chosen from a user’s VOSpace or MyDB. If the table you wish to crossmatch is not yet in MyDB but is stored on your local computer, you may upload your table to MyDB as a CSV file by clicking on the Table Management tab. Your CSV file should contain at least these three columns: id, ra, and dec where RA and dec are both in decimal degrees. For example, an acceptable CSV file would be formatted in the following way:
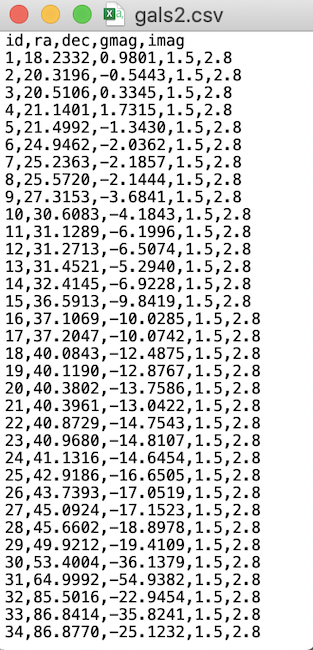
Once you have your CSV file properly formatted, you may name it and upload it as a table to your MyDB.
Back in the Xmatch tab, you may now choose your table from the drop down menu under Step 1. You will be prompted to choose the RA column name and the DEC column name in your table as well as to select the output columns.

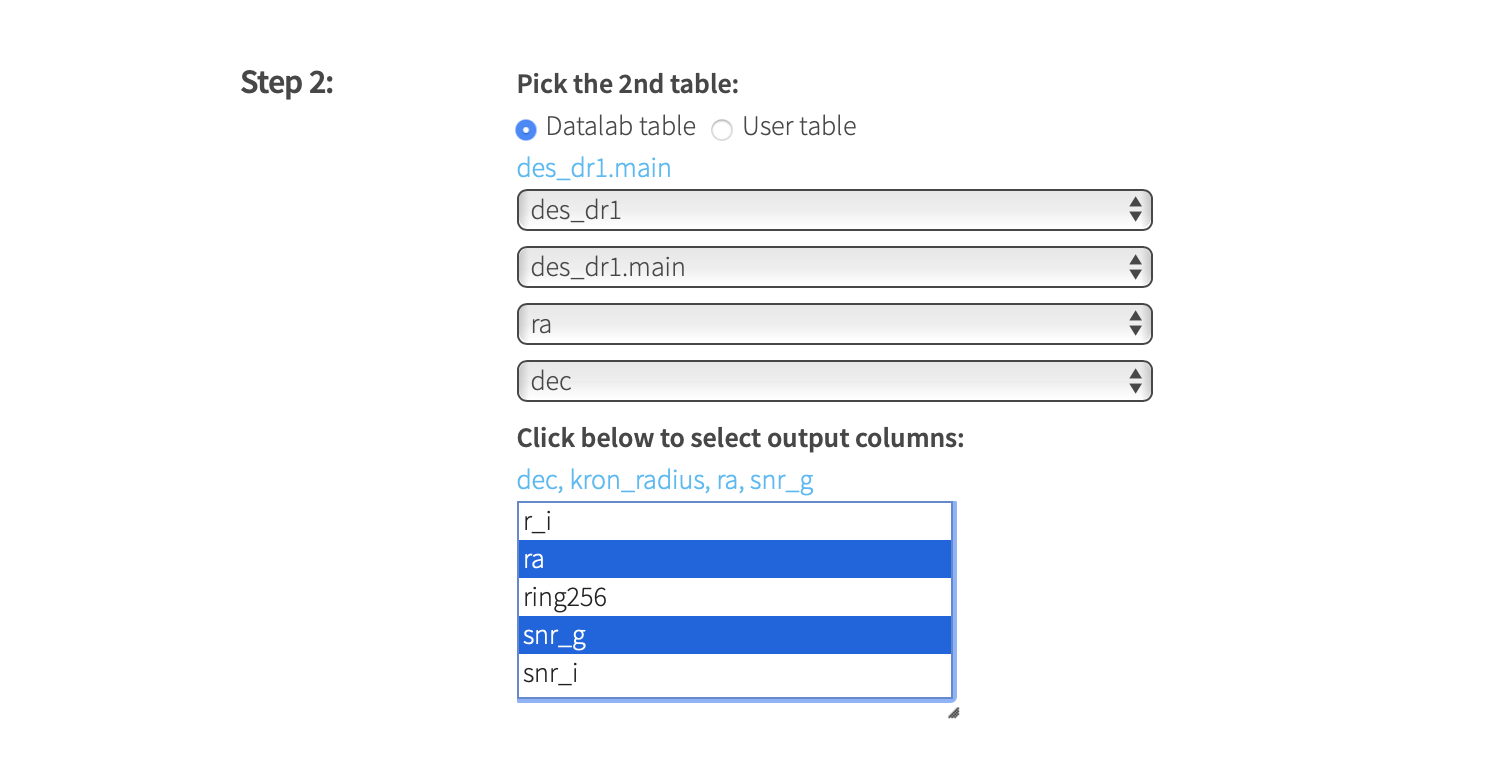
The 2nd step is to pick the 2nd table from the drop down menu, which may either be a Data Lab table or a user-provided table. If you choose to use a Data Lab table, it will first prompt you to choose a dataset/schema then to choose a table in that dataset/schema. You will be prompted to choose the RA column name and the DEC column name from that table as well as to select the output columns. Here we have chosen the main table from the des_dr1 dataset to output the columns dec, kron_radius, ra, and snr_g. Note that hovering over an output column name will provide the column description.
The 3rd step is to name the result table, set the search radius in arcsec, and to choose to find all matches or just the nearest neighbor. Finally we can Submit the X-match in step 4 after which the crossmatch query will be executed and the table will be created in your MyDB. A message to this effect will appear on the screen. Note that an additional column will appear in your table: dist_arcsec, the distance between ra1, dec1 and ra2, dec2.

To access the MyDB table you will need to use one of our other Data Lab clients, such as the datalab command or through a Jupyter notebook, both are demonstrated below. On the command line,
> datalab query --sql="select * from mydb://results" # print to screen
> datalab query --sql="select * from mydb://results" --out="./results" # output to local file
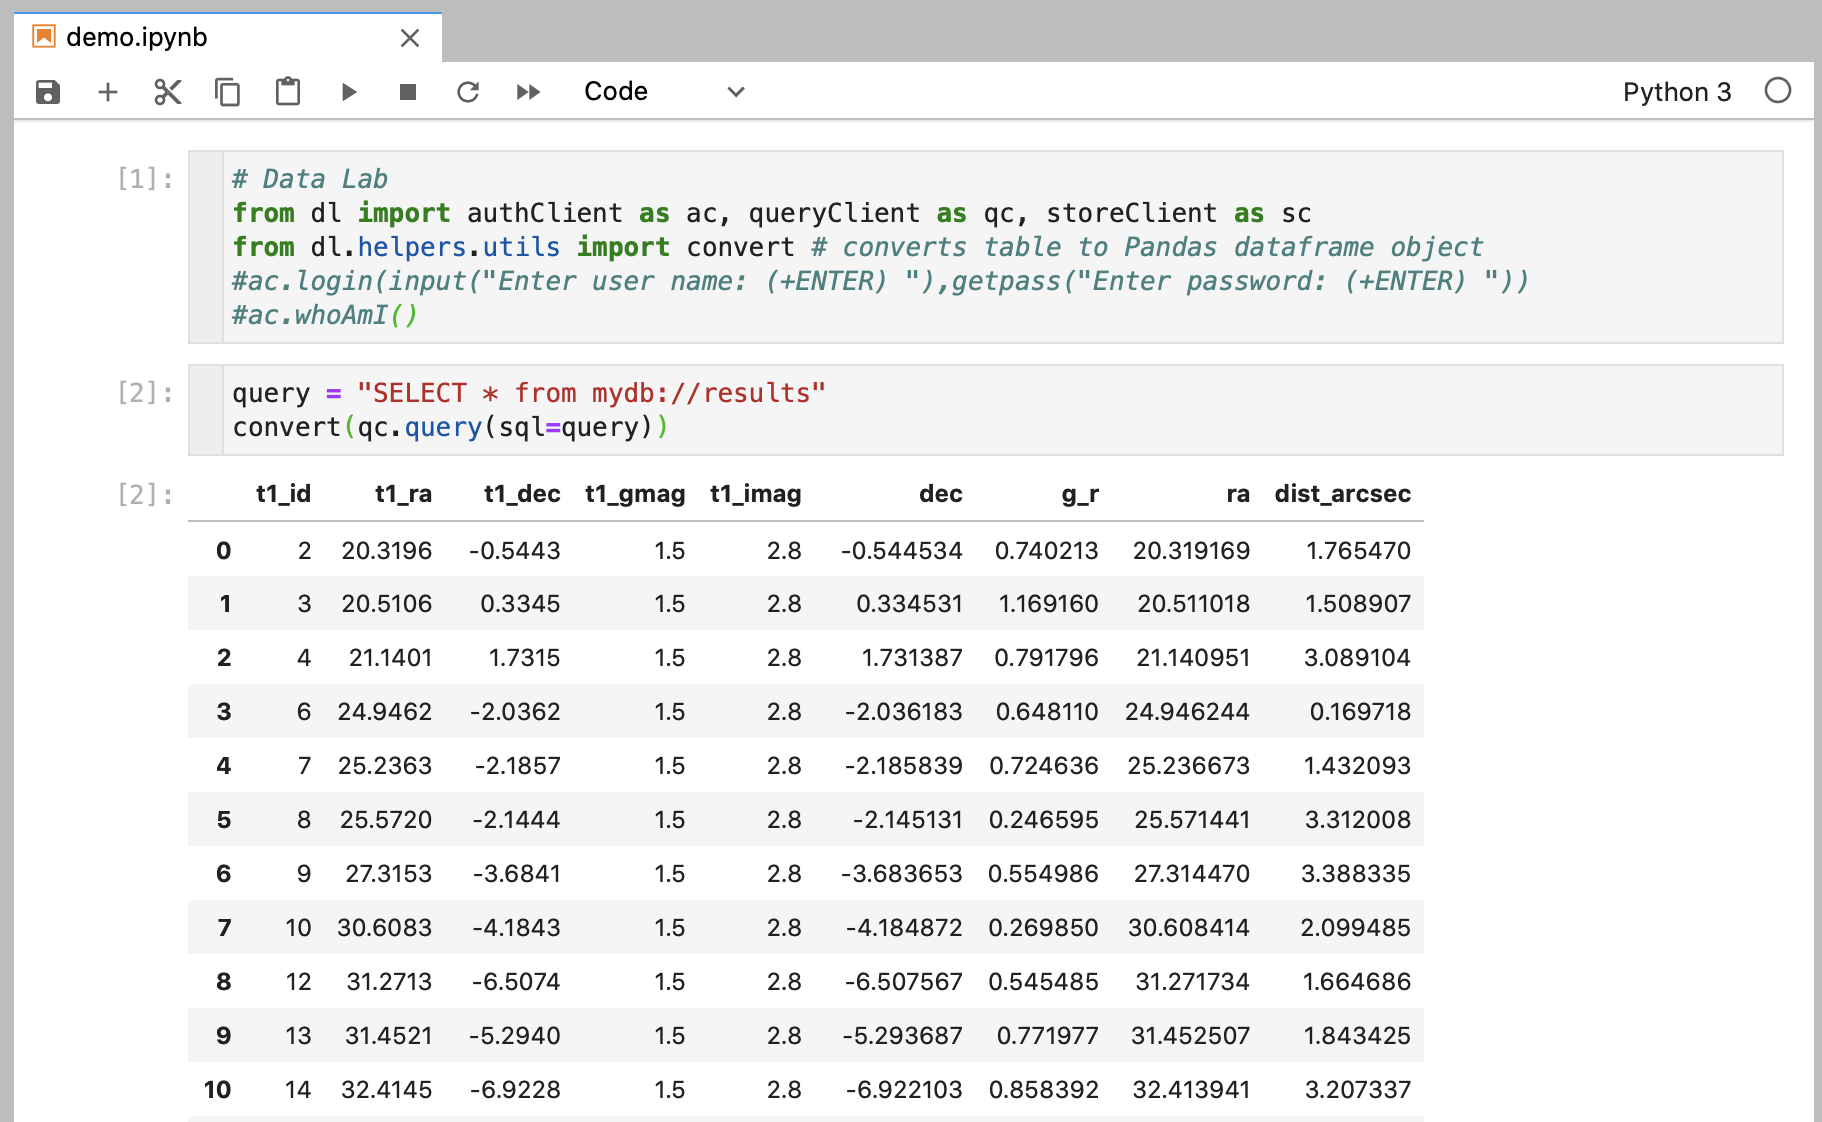
We can also access the MyDB table by using a Jupyter notebook and Data Lab’s queryClient. We write an SQL query to retrieve the results table from MyDB and print it on screen.