GNIRS-DQS (Gemini Near-Infrared Spectrograph - Distant Quasar Survey)
First released at Astro Data Lab in 2022-06.
Description
Our current understanding of supermassive black hole (SMBH) growth in the distant universe is compromised by the lack of key diagnostic rest-frame optical emission lines in quasar spectra. As a consequence, our view of how SMBHs and their host galaxies mutually coevolve during the peak of quasar activity is biased and incomplete. The GNIRS-DQS survey has obtained high-quality GNIRS spectroscopic observations in the 1.0-2.5 micron band, for a uniform sample of 260 Sloan Digital Sky Survey (SDSS) quasars at redshifts between 1.5 and 3.5. This survey more than doubles the existing inventory of near-infrared spectra from luminous quasars at these redshifts. The measurements facilitate a more complete understanding of how the rest-frame UV-optical spectral properties depend on redshift and luminosity, and test whether the physical properties of the quasar central engine evolve over cosmic time. The next generation of cosmological surveys will generate millions of optical quasar spectra, whose analysis will greatly benefit from the information garnered in this Gemini Legacy program.
The gnirs_dqs.spec_measurements table has been crossmatched against our default reference datasets within a 1.5 arcsec radius, nearest neighbor only. These tables will appear with x1p5 in their name in our table browser. Example: gnirs_dqs.x1p5__spec_measurements__gaia_dr3__gaia_source.
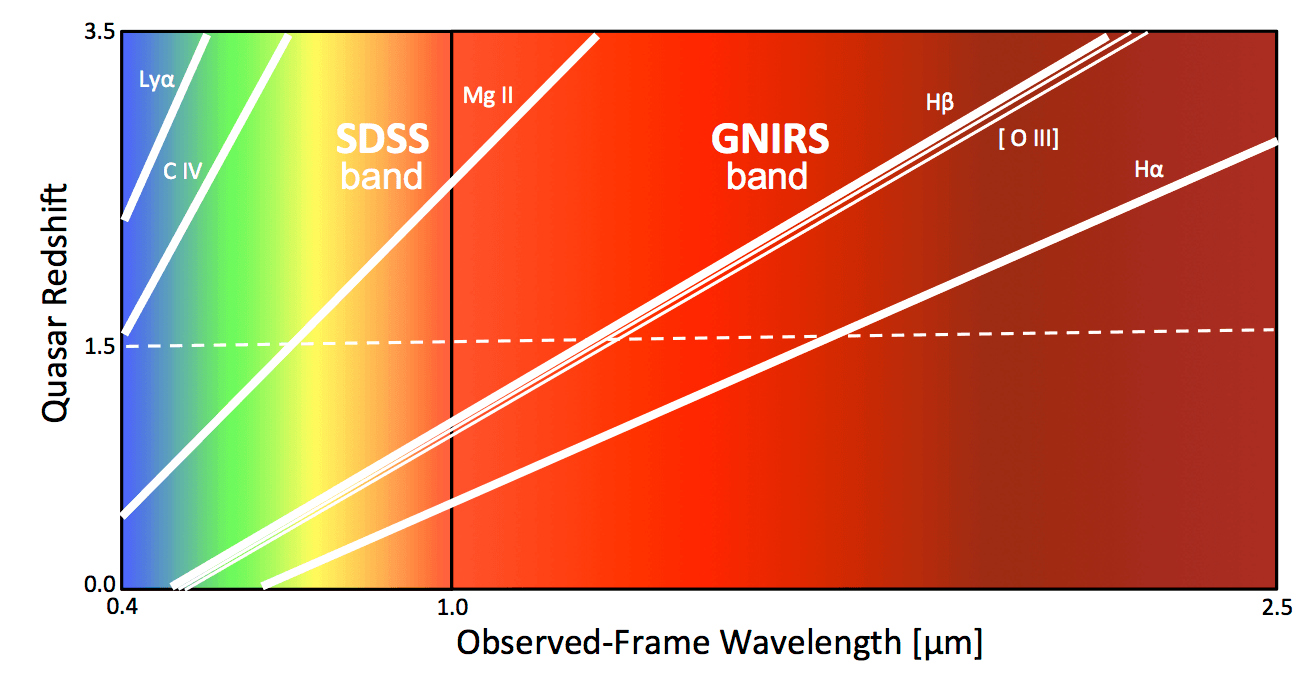
Figure: At sufficiently high redshifts several prominent quasar emission features (white solid lines) are no longer detectable in the optical range, represented here by the SDSS band that extends between approximately 0.4 micron and 1.0 micron (solid black line). For the broad Hβ and narrow [O III] lines that are rich in diagnostic power, this occurs above redshift 1, including the era of fast quasar growth. GNIRS-DQS more than triples the observed spectral band, allowing us to observe these and other emission lines in a uniform sample of 260 SDSS quasars at redshifts between 1.5 (dashed line) and 3.5. The available SDSS spectra of these sources, which cover at least the rest-frame ultraviolet C IV emission line, enable us to establish connections between optical and ultraviolet indicators of fundamental quasar properties while more than doubling the statistics at such high redshifts.
Data Releases
First Data Release
This survey comprises spectroscopic measurements for 260 sources from the Gemini Near-Infrared Spectrograph - Distant Quasar Survey (GNIRS-DQS). Being the largest uniform, homogeneous survey of its kind, it represents a flux-limited sample (≲19.0 mag, ≲16.5 mag) of Sloan Digital Sky Survey (SDSS) quasars at 1.5 < z < 3.5 with a monochromatic luminosity (λLλ) at 5100Å in the range of 1044-1046 erg s⁻¹. A combination of the GNIRS and SDSS spectra covers principal quasar diagnostic features, chiefly the C IV λ1549, Mg II λ2798, λ2803, Hβ λ4861, and [O III] λ4959, λ5007 emission lines, in each source.
Below see a brief description for the corresponding files associated with the survey. They are accessible through the Data Lab file service.
-
ASCIIs: Each quasar has a corresponding ASCII file containing select data about certain features of the quasar. These ASCII files are broken up into columns:
- obj : SDSS designation
- ra, dec : Right ascension, Declination in degrees
- zsys : Systemic redshift as measured by the best available spectral indicator
Depending on the existence of certain lines, which is a product of a variety of factors which include things like redshift and noise, the subsequent columns are organized into bunches that represent information about one emission line (Halpha = ha, Hbeta = hb, Mg II = mg2, O III = o3, Fe II = fe2):
- lc_* : Line center
- low_lc_* : Lower uncertainty in line center
- upp_lc_* : Upper uncertainty in line center
- fwhm_* : FWHM
- low_fwhm_* : Lower uncertainty in FWHM
- upp_fwhm_* : Upper uncertainty in FWHM
- ew_* : Equivalent width
- low_ew_* : Lower uncertainty in equivalent width
- upp_ew_* : Upper uncertainty in equivalent width
- as_* : Asymmetry of the double Gaussian profile
- kurt_* : Kurtosis of the double Gaussian profile
Absent emission lines are indicated by a series of zeroes.
- Data files: These are the CSV tables associated with the published version of the GNIRS-DQS survey and redshift analysis paper by Matthews et al. (2021), ApJS, 252, 15. A description of the tables and their respective formatting can be found in the paper itself.
Descriptions and further information can be found in the corresponding survey paper (https://iopscience.iop.org/article/10.3847/1538-4365/abc705). For questions about GNIRS-DQS please contact Brandon Matthews (BrandonMatthews at my.unt.edu).
Data Access
The GNIRS-DQS data are accessible by a variety of means:
Data Lab Table Access Protocol (TAP) service
TAP provides a convenient access layer to the GNIRS-DQS catalog database. TAP-aware clients (such as TOPCAT) can point to https://datalab.noirlab.edu/tap, select the gnirs_dqs database, and see the database tables and descriptions. You can also view the GNIRS-DQS tables and descriptions in the Data Lab table browser.
Data Lab Query Client
The Query Client is available as part of the Data Lab software distribution. The Query Client provides a Python API to Data Lab database services. These services include anonymous and authenticated access through synchronous or asynchronous queries of the catalog made directly to the database. Additional Data Lab services for registered users include personal database storage and storage through the Data Lab VOSpace.
The Query Client can be called from a Jupyter Notebook on the Data Lab Notebook server. Example notebooks are provided to users upon creation of their user account (register here), and are also available to browse on GitHub at https://github.com/astro-datalab/notebooks-latest.
Jupyter Notebook Server
The Data Lab Jupyter Notebook server (authenticated service) contains an example of how to access and visualize the GNIRS-DQS catalog: