NSC (NOIRLab Source Catalog)
Description
The NOIRLab Source Catalog (NSC) is a catalog of nearly all of the public imaging data in NOIRLab's Astro Data Archive. These images from telescopes in both hemispheres nearly cover the entire sky.
While the large majority of these data were obtained for PI-led projects, only a fraction have been released to the community via well-calibrated and easily accessible catalogs. The NSC remedies this situation by creating a catalog of sources from most of the public data taken on CTIO-4m+DECam as well as KPNO-4m+Mosaic3 and some from the Bok-2.3+90Prime. The second NSC public data release (DR2) contains over 3.9 billion unique objects, 68 billion individual source measurements, covers ∼35,000 square degrees of the sky, has depths of ∼23rd magnitude in most broadband filters with ∼1-2% photometry, accurate proper motions, and an astrometric accuracy of ∼2 mas. The first NSC public data release (DR1) contains over 2.9 billion unique objects, 34 billion individual source measurements, covers ∼30,000 square degrees of the sky, has depths of ∼23rd magnitude in most broadband filters with ∼1-2% photometry, and an astrometric accuracy of ∼2 mas.
The NSC is useful for exploring stellar streams, dwarf satellite galaxies, variable stars, hight proper motion objects, QSO variability, and transients. Browse this page to learn more about NSC DR2 and NSC DR1 and how to access the data. The NSC DR2 paper (Nidever et al. 2020) describes the catalog in detail, including the source extraction, calibration, combination, quality assurance, and science use cases. Also, see Nidever et al. 2018 for NSC DR1 information.
The nsc_dr2.object table has been crossmatched with all other datasets in Data Lab within a 1.5 arcsec radius, nearest neighbor only. These tables will appear with x1p5 in their name in our table browser. Example: nsc_dr2.x1p5__object__gaia_dr3__gaia_source.
Scientific Goals and Use Cases
NSC is meant to be a community release and make the data in the NOIRLab Astro Data Archive holdings more readily available to scientific exploitation. There are several potential science use cases of the NSC catalog.
- Local Group Dwarf Galaxies. The Milky Way is orbited by faint dwarf galaxies satellite that can be challenging to detect. The best method to discovery these objects has been with resolved stellar populations as recently demonstrated by Bechtol et al. (2015) and Drlica-Wagner et al. (2015) using DECam data from the Dark Energy Survey. The NSC includes data of resolved stellar populations for regions of the sky previously unexplored for dwarf galaxies.
- Stellar Streams. The Milky Way halo hosts a number of stellar streams from tidally stripped galaxies and globular clusters. One of the most famous streams is the Sagittarius stellar stream that stretches more than 360 degrees around the sky. Under the currently-favored hierarchical galaxy formation model, galaxies like our Milky Way are formed through the continual merging and accretion of smaller galaxies. The streams that we currently see are relics of this process. Studying these streams we can help us understand how our galaxy was formed and what its accretion history is. The NSC covers regions of the sky that have not yet been explored for stellar streams.
- High Proper Motion Objects. The NSC DR2's accurate proper motions and unrivaled combination of depth and areal coverage make it a unique resource for discovering rare moving objects such as late-type L and T subdwarfs (e.g, Kirkpatrick et al. 2014, Zhang et al. 2018). The NSC can measure motions to several magnitudes beyond the Gaia limit for sources of all colors, enabling proper motion studies in the Galactic halo, such as searches for hypervelocity stars being ejected from the Milky Way (e.g., Boubert et al. 2018).
- Solar System Objects. The NSC temporal information can be used to detect solar system objects and there is a large interest in finding near earth objects that could potentially impact the earth. In addition, there is a big search for Planet 9 and if it exists the proof could be lurking inside the NSC.
- Variability. Many astronomical objects vary with time either in their brightness or position in the sky. The temporal information in the NSC can be used to investigate the photometric astrometric variability of objects. The NSC has ∼10,000 square degrees with tens of exposures, ∼1,000 square degrees with hundreds of exposures and ∼50 square degrees with thousands of exposures. NSC DR2 also includes eight precomputed photometric variability metrics to make easier to select variable objects with 23 million objects already flagged as being variable at the 10 sigma level.
Variable stars, such as RR Lyrae, are essentially standard candles and are used to explore stellar structures in the Milky Way halo.
Active Galactic Nuclei (AGN) host supermassive black holes at the centers of galaxies and investigating their photometric variability can be used to study the accretion history of material onto the black hole as well as estimate the black hole mass.
Transient events, like supernova explosions can be used to study interesting astrophysical phenomena as well as the expansion of the universe.
The NSC information can be used to study all of these phenomena across essentially the entire sky.
Data Releases
NSC DR2
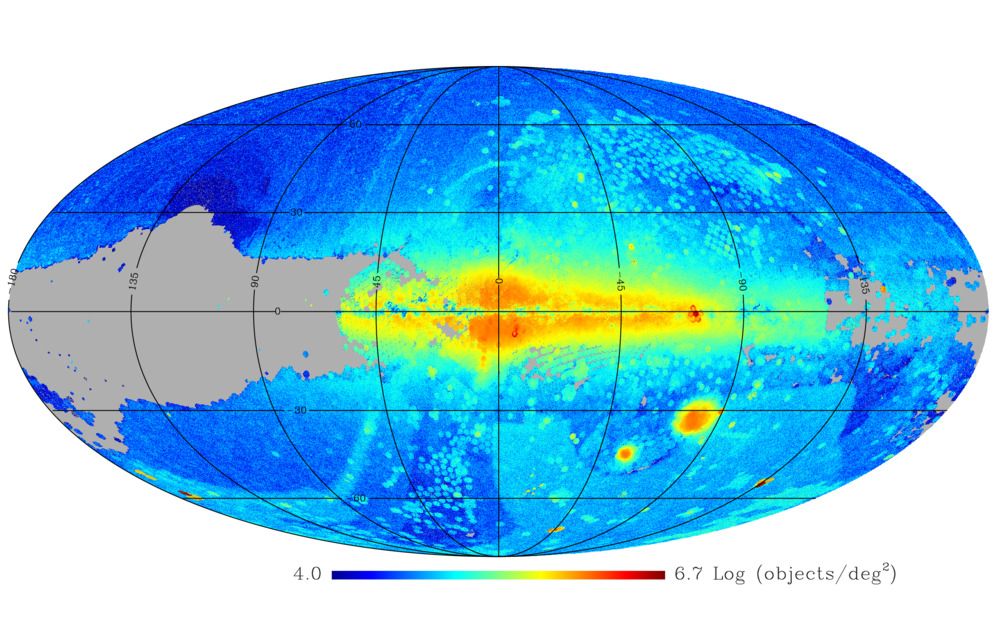
The figure below shows the density of the 3.9 billion objects in the NSC DR2 catalog covering ∼35,000 square degrees. There are 68 billion measurements from 412 thousand exposures. There are five main NSC DR2 tables in the database, described in the table below.
| NSC DR2 Summary | |
|---|---|
| Area covered | 35,273 deg² |
| Bands | u, g, r, i, z, Y, VR |
| Median Depth (95th%) | 22.6, 23.6, 23.2, 22.8, 22.3, 21.0, 23.3 mag |
| Median seeing | 1.35, 1.30, 1.18, 1.03, 1.01, 0.99, 1.15 arcsec |
| Number of exposures | 412,116 |
| Number of objects | 3,932,838,064 |
| Number of individual measurements | 67,822,619,019 |
| Photometric calibration accuracy | ∼1-2% |
| Astrometric zero-point accuracy | ∼2 mas |
| NSC DR2 Tables | |
|---|---|
| Table Name | Description |
| chip | Information for each unique chip image with astrometric correction terms and uncertainties. (24,416,997 rows) |
| coverage | Coverage information for each nside=4096 healpix pixel with a resolution of ∼1 arcmin. This gives coverage fraction and depth for each band. (172,157,952 rows) |
| exposure | Information for each unique exposure with zero-point values and uncertainties. (412,116 rows) |
| meas | Information on each individual source measurement. (67,822,619,019 rows) |
| object | Information on each unique object with average photometric and astrometric values. (3,932,838,064 rows) |
NSC DR2 Object Density Map:
NSC DR1
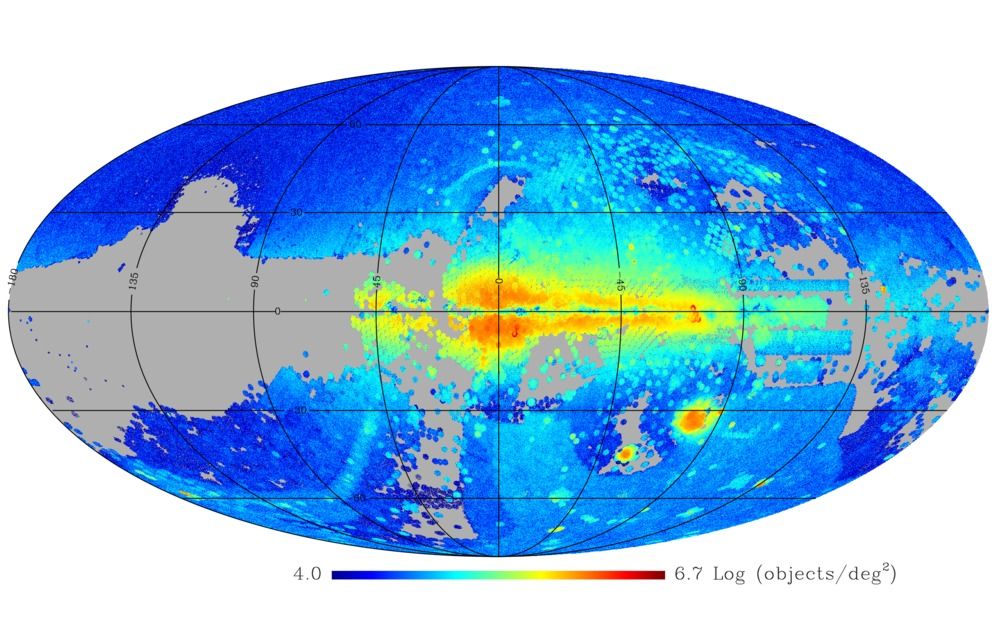
The figure below shows the density of the 2.9 billion objects in the NSC DR1 catalog covering ∼30,000 square degrees. There are 34 billion measurements from 255 thousand exposures. There are six main NSC DR1 tables in the database, described in the table below.
| NSC DR1 Summary | |
|---|---|
| Area covered | 30,382 deg² |
| Bands | u, g, r, i, z, Y, VR |
| Median Depth (10σ) | 22.4, 22.9, 22.6, 22.4, 21.6, 20.4, 22.9 mag |
| Median Depth (95th%) | 23.1, 23.3, 23.2, 22.9, 22.2, 21.0, 23.1 mag |
| Median seeing | 1.35, 1.30, 1.18, 1.03, 1.01, 0.99, 1.15 arcsec |
| Number of exposures | 255,454 |
| Number of objects | 2,930,644,736 |
| Number of individual measurements | 34,658,213,888 |
| Photometric calibration accuracy | ∼1-2% |
| Astrometric zero-point accuracy | ∼2 mas |
| NSC DR1 Tables | |
|---|---|
| Table Name | Description |
| chip | Information for each unique chip image with astrometric correction terms and uncertainties. (12,008,634 rows) |
| coverage | Coverage information for each nside=4096 healpix pixel with a resolution of ∼1 arcmin. This gives coverage fraction and depth for each band. (201,326,592 rows) |
| exposure | Information for each unique exposure with zero-point values and uncertainties. (255,454 rows) |
| meas | Information on each individual source measurement. (34,658,213,888 rows) |
| nsc_allwise | NSC vs ALLWISE 1-arcsec crossmatch (367,260,220 rows) |
| object | Information on each unique object with average photometric and astrometric values. (2,930,644,736 rows) |
NSC DR1 Object Density Map:
Data Processing
The NSC data processing makes use of three separate software packages: (1) the Community Pipeline (CP) for instrument signature removal (Valdes et al. 2014), (2) Source Extractor (Bertin & Arnouts 1996) for performing source extraction from the images, and (3) custom software (in python and IDL) to run SExtractor on the images and to perform calibration and combination.
- Reduction. All of the images were reduced by the NOIRLab Community Pipeline. The instrumentally calibrated ("InstCal") images with the instrumental signature removed were used for further analysis to create the NSC catalogs.
- Measurement. Source Extractor was run on each individual chip image to extract aperture photometry and morphological parameters. The SExtractor configuration parameters are available here and were modified slightly for each image (seeing, gain, saturation level and circular aperture sizes). In the future, we plan to perform PSF photometry on individual exposures and stacked images.
- Calibration. The zero-point for each exposure was obtained by using publicly available catalogs. For grizY exposures above -29 degrees declination the Pan-STARRS1 DR1 catalog was used. For the southern exposures in griz bands, zero-points were derived using ATLAS-Refcat2 stars. For u-band exposures below 0 degree declination, zero-points were derived using SkyMapper DR1. VR-band exposures were calibrated using the average of the r-band (PS1 in the north and ATLAS-Refcat2 in the south) and Gaia DR2 G magnitudes. Finally, model magnitudes were used for u-band exposures with positive declinations using GALEX, Gaia DR2 and 2MASS photometry, and for Y-band exposures with declinations below -29 deg using 2MASS photometry. Extinction values to construct dereddened colors were calculated using the Schlegel, Finkbeiner & David (1998) reddening map and RJCE method (Rayleigh-Jeans Color Excess, Majewski et al. 2011), using 2MASS, Spitzer, and WISE infrared photometry, in higher extinction regions. The astrometry of each chip (the WCS) was calibrated using the Gaia DR2 catalog and corrections for proper motion to the epoch of the observation.
- Combination. Quality cuts were used to remove exposures with poor seeing, bad zero-points, large spatial variations in the zero-point, or poor astrometric calibration. Furthermore, quality cuts were also applied to the individual source measurements that were affected by bad pixels, truncated at the edge, or had low signal-to-noise (S/N<5). Finally, measurements from multiple overlapping exposures were combined on a HEALPix (nside=128) pixel basis. The grouping algorithm of measurements into objects was substantially upgraded in DR2 to better handle faster moving stars and more robustly measure proper motions. First, the NSC DR2 measurements in a single HEALPix were clustered using DBSCAN with a clustering distance of 0.4 seconds to create object "seeds". Second, any remaining measurements were crossmatched to the seeds using a radius of three times their astrometric uncertainty. The second step is needed because DBSCAN does not take positional uncertainties into account. Average magnitudes and morphological parameters (in each band), proper motions, and photometric variability metrics were then computed for each object.
Data Access
The NSC data are accessible by a variety of means:
Data Lab Table Access Protocol (TAP) service
TAP provides a convenient access layer to the NSC catalog database. TAP-aware clients (such as TOPCAT) can point to https://datalab.noirlab.edu/tap, select the nsc_dr2 database, and see the database tables and descriptions. You can also view the NSC tables and descriptions in the Data Lab table browser.
Data Lab Query Client
The Query Client is available as part of the Data Lab software distribution. The Query Client provides a Python API to Data Lab database services. These services include anonymous and authenticated access through synchronous or asynchronous queries of the catalog made directly to the database. Additional Data Lab services for registered users include personal database storage and storage through the Data Lab VOSpace.
The Query Client can be called from a Jupyter Notebook on the Data Lab Notebook server. Example notebooks are provided to users upon creation of their user account (register here), and are also available to browse on GitHub at https://github.com/astro-datalab/notebooks-latest.
Image Cutouts
The Data Lab Simple Image Access (SIA) service provides a fast way to retrieve cutouts from NSC images. See our Jupyter notebook on how to use the SIA service.
For NSC DR2, the SIA URL is:
https://datalab.noirlab.edu/sia/nsc_dr2
Jupyter Notebook Server
The Data Lab Jupyter Notebook server (authenticated service) contains examples of how to access and visualize the NSC catalog:
Acknowledgments
The NSF NOIRLab is operated by the Association of Universities for Research in Astronomy (AURA) under a cooperative agreement with the National Science Foundation. Database access and other data services are provided by the NOIRLab Data Lab.
This project used data obtained with the Dark Energy Camera (DECam), which was constructed by the Dark Energy Survey (DES) collaboration. Funding for the DES Projects has been provided by the U.S. Department of Energy, the U.S. National Science Foundation, the Ministry of Science and Education of Spain, the Science and Technology Facilities Council of the United Kingdom, the Higher Education Funding Council for England, the National Center for Supercomputing Applications at the University of Illinois at Urbana-Champaign, the Kavli Institute of Cosmological Physics at the University of Chicago, Center for Cosmology and Astro-Particle Physics at the Ohio State University, the Mitchell Institute for Fundamental Physics and Astronomy at Texas A&M University, Financiadora de Estudos e Projetos, Fundação Carlos Chagas Filho de Amparo, Financiadora de Estudos e Projetos, Fundação Carlos Chagas Filho de Amparo à Pesquisa do Estado do Rio de Janeiro, Conselho Nacional de Desenvolvimento Científico e Tecnológico and the Ministério da Ciência, Tecnologia e Inovação, the Deutsche Forschungsgemeinschaft and the Collaborating Institutions in the Dark Energy Survey. The Collaborating Institutions are Argonne National Laboratory, the University of California at Santa Cruz, the University of Cambridge, Centro de Investigaciones Enérgeticas, Medioambientales y Tecnológicas–Madrid, the University of Chicago, University College London, the DES-Brazil Consortium, the University of Edinburgh, the Eidgenössische Technische Hochschule (ETH) Zürich, Fermi National Accelerator Laboratory, the University of Illinois at Urbana-Champaign, the Institut de Ciències de l'Espai (IEEC/CSIC), the Institut de Física d'Altes Energies, Lawrence Berkeley National Laboratory, the Ludwig-Maximilians Universität München and the associated Excellence Cluster Universe, the University of Michigan, the National Optical Astronomy Observatory, the University of Nottingham, the Ohio State University, the University of Pennsylvania, the University of Portsmouth, SLAC National Accelerator Laboratory, Stanford University, the University of Sussex, and Texas A&M University.
BASS is a key project of the Telescope Access Program (TAP), which has been funded by the National Astronomical Observatories of China, the Chinese Academy of Sciences (the Strategic Priority Research Program "The Emergence of Cosmological Structures" Grant # XDB09000000), and the Special Fund for Astronomy from the Ministry of Finance. The BASS is also supported by the External Cooperation Program of Chinese Academy of Sciences (Grant # 114A11KYSB20160057), and Chinese National Natural Science Foundation (Grant # 11433005).