
We are happy to share with you the latest developments at Astro Data Lab in this June 2026 newsletter!
In this newsletter
- New SPARCL release featuring units and specutils
- New datasets at Astro Data Lab
- New Jupyter notebooks
- Astro Data Lab featured on the Project Jupyter Blog
New SPARCL release featuring units and specutils
 The SPARCL spectroscopic service continues to add new features that make working with spectroscopic data in Python easier and more flexible. Recent updates highlighted in the SPARCL User Manual introduce new output formats including
 'specutils', which returns spectra in a format ready to use with the Astropy/specutils ecosystem, and 'pandas', which makes it simple to load results directly into Pandas DataFrames for exploration and analysis.
SPARCL can also now return units for fields representing physical quantities, helping users preserve important metadata and perform more reliable unit-aware calculations. These updates help streamline the workflow from data access to science analysis using familiar Python tools.
Figure: Screenshot from the How To Use SPARCL Jupyter notebook showing the spectrum of a QSO object from BOSS-DR17 retrieved using SPARCL.
New datasets at Astro Data Lab
PHATTER
 The PHATTER dataset contains UV-optical-NIR photometry for 22 million stars in the central ~0.1 deg² of M33 for the Panchromatic Hubble Andromeda Treasury: Triangulum Extended Region ("PHATTER") survey.
They use the filters F275W and F336W on the WFC3/UVIS camera, F475W and F814W on ACS/WFC, and the F110W and F160W on WFC3/IR. UVIS data reach a magnitude limit of ~25 in F275W and F336W. ACS data reach maximum depths of ~28 magnitudes in F475W and ~27 magnitudes in F814W in the uncrowded outer disk. In these same regions, WFC3/IR data reach maximum depths of ~26.5 and ~25.5 in F110W and F160W, respectively.
The source catalog is available at Astro Data Lab as phatter.phot_mod.
Figure: The approximate footprints of each photometric subsection of PHATTER are plotted on a Sloan Digital Sky Survey (SDSS) image of M33.
VISTA survey of the Magellanic Cloud System (VMC)
The main goals of the VMC survey are the determination of the spatially resolved star formation history and the three-dimensional geometry of the Magellanic system. Observations were obtained with the VISTA telescope as part of the VISTA survey of the Magellanic Cloud system (VMC; ESO program 179.B-2003) in three filters: Y, J, and Ks. The sensitivity of the data is designed to reach sources below the oldest main-sequence turn off point of the stellar population and the multi-epochs to measure accurate Ks mean magnitudes for pulsating variable stars, e.g., RR Lyrae stars and Cepheids.
The survey produced two main tables, which are available at Astro Data Lab as vmc_dr7.source and vmc_dr7.psfsource.
 Figure: Footprint of the VMC survey across the Magellanic System, showing survey tiles overlaid on the distribution of carbon stars, stellar clusters, and associations. Each tile includes deep multi-epoch observations in the Y, J, and Ks bands, along with complementary shallow observations.
DESI DR1 VAC with emission-line fitting results
The desi_dr1.emfit Value-Added Catalog (VAC) contains the fit parameters associated with H_beta, [OIII]4959,5007, [NII]6548,6583, H_alpha, and [SII]6716,6731 emission lines in low-redshift (z <= 0.45) sources in DESI DR1. It includes testing for extra components for [OIII], [SII], and H_alpha. For more information about this catalog, see the DESI data page on EmFit.
SGA2020 galaxy morphology measurements VAC
 The new sga2020.zoobot Value-Added Catalog (VAC) provides deep-learning-based galaxy morphology measurements for galaxies in the SGA2020 survey.
Using the Zoobot framework developed for galaxy classification, the catalog characterizes key morphological features such as spiral arm structure, bars, merger and tidal signatures, and galaxy shape properties including smoothness, edge-on orientation, and bulge prominence. These measurements enable large-scale studies of galaxy structure and evolution using modern machine learning techniques.
Figure: Distribution of the SGA-2020 sample in an equal-area Aitoff projection in equatorial coordinates. Source: Legacy Surveys webpage.
Data Lab cross-matched tables
The Data Lab team has already cross-matched the PHATTER "phot_mod" table as well as the VMC DR7 "psfsource" and "source" tables with our reference datasets: Gaia DR3 (for astrometry), AllWISE, NSC DR2, and unWISE DR1 (for photometry), and vice versa. The VMC DR7 tables have also been crossmatched with the SDSS DR17 apogee2_allstar table from the request of the data providers. We have also added a few other useful columns such as nest4096, ring256, and htm9 for sky tessellation use cases. The pre-crossmatched tables are accessible in the Catalogs section of the Data Explorer, and through standard TAP/SQL/ADQL queries, like all other catalogs at Data Lab.
Dataset requests
The Data Lab team evaluates periodically which external survey datasets we should source, ingest, and serve. We appreciate requests and suggestions from our users. Please contact us at datalab@noirlab.edu to send your request and, if possible, mention an example scientific use case.
New Jupyter notebooks
Several new notebooks were recently added to Data Lab's extensive collection of notebooks for our user community:
Getting Started with KS4 DR1
Authors: Seo-Won Chang and the KS4 Team

This introductory notebook provides a comprehensive first look at the KMTNet Synoptic Survey of the Southern Sky First Data Release (KS4 DR1), now available on Astro Data Lab. KS4 DR1 covers ~4,000 deg² of the southern sky (-85° < Dec < -28.8°) in the B, V, R, and I bands using a network of three 1.6-m telescopes, reaching median 5σ depths of 22.0-23.5 AB mag and containing over 200 million sources. The notebook walks users through the two main catalog tables, ks4_dr1.idual_master, an I-band-selected forced-photometry catalog optimized for consistent multi-band colors, and ks4_dr1.single_master, a band-merged catalog offering enhanced source completeness, and demonstrates how to run basic SQL queries via the Data Lab query client. It also covers essential quality filtering using SExtractor flags, image flags, and the spurious source flag; extinction correction; and spatial queries using Q3C. Practical science use cases are illustrated throughout, including visualizing the survey footprint, plotting magnitude distributions and survey depth, constructing a color-magnitude diagram of the globular cluster 47 Tuc, and exploring dithering patterns using the ndith column.
Figure: Sky coverage of the KS4 DR1 catalog shown in Galactic coordinates. Each point represents the mean position of sources within a coarse HEALPix cell. The survey spans ~4,000 deg² of the southern sky at −85° < Dec < −28.8°, with observations carried out by the KMTNet telescope network at CTIO, SAAO, and SSO.
Source Classification Guidance & Pre-matched External Catalogs in KS4 DR1
Authors: Seo-Won Chang and the KS4 Team

Building on the techniques introduced in the getting-started notebook, this second KS4 DR1 notebook focuses on source classification and catalog cross-matching. It begins with a detailed exploration of the SExtractor class_star stellarity index, showing how the parameter behaves as a function of magnitude and across the B, V, R, and I bands, and providing practical guidance on choosing appropriate classification thresholds for different science cases. The notebook then demonstrates how to perform positional cross-matches with Gaia DR3 using Q3C's q3c_join function directly within SQL, including an astrometric comparison that validates KS4's positional accuracy against Gaia. Finally, it introduces the eight pre-computed cross-match tables provided as part of KS4 DR1, which cover external catalogs such as ALLWISE, unWISE DR1, VHS DR5, SkyMapper DR4, NSC DR2, DELVE DR2, and DELVE DR3. It also demonstrates how to use these tables for efficient multi-wavelength photometry queries without the computational overhead associated with on-the-fly spatial joins.
Figure: SExtractor stellarity index (class_star_i) as a function of I-band AUTO magnitude for a clean sample of sources in a sparse, high-Galactic-latitude field. The hexbin density map (log scale) reveals a clear bimodal separation between point sources (class_star ~ 1) and extended sources (class_star ~ 0) at bright magnitudes (I ≲ 20), which progressively blurs toward fainter magnitudes as source signal-to-noise decreases. Dashed horizontal lines mark commonly used classification thresholds at class_star = 0.3, 0.5, and 0.8.
Stacking SDSS Spectra of Stars and Galaxies Selected by Color
Authors: Stéphanie Juneau (NOIRLab), Ragadeepika Pucha (U.Utah) and The Astro Data Lab Team
 Figure: Stacked SDSS spectra of galaxies in eight bins of color. The top panel includes only 5 spectra per bin while the bottom panel shows stacks with 200 spectra per bin, resulting in a much higher signal-to-noise ratio and revealing intrinsically weak spectral features.
How to Use SPARCL (now with units and specutils/pandas examples)
Authors: Alice Jacques, Steve Pothier, Adam Bolton, and the SPARCL Team
The updated "How to use SPARCL" Jupyter notebook introduces several new features designed to make spectroscopic data workflows smoother and more Python-friendly. Users can now retrieve results directly in 'specutils' format for easy integration with the Astropy/specutils analysis ecosystem, or use fmt='pandas' to work with results as Pandas DataFrames for quick exploration and analysis. The notebook also demonstrates how SPARCL can now return units for fields that hold physical quantities, making it easier to preserve important metadata and perform unit-aware scientific analysis. These additions help simplify the path from data access to science-ready workflows in Python.
Astro Data Lab featured on the Project Jupyter Blog
A recent Project Jupyter Blog post spotlights how Astro Data Lab is enabling astronomers to explore petabyte-scale sky survey data directly through Jupyter notebooks. The article highlights how researchers can access powerful analysis tools, databases, and science services without needing to download massive datasets or maintain local computing infrastructure. By bringing computation closer to the data, Astro Data Lab helps streamline workflows for everything from large survey science to classroom learning and collaborative research. The post also showcases how Jupyter notebooks support reproducible, accessible, and scalable astronomy research for scientists, students, and the broader astronomy community.
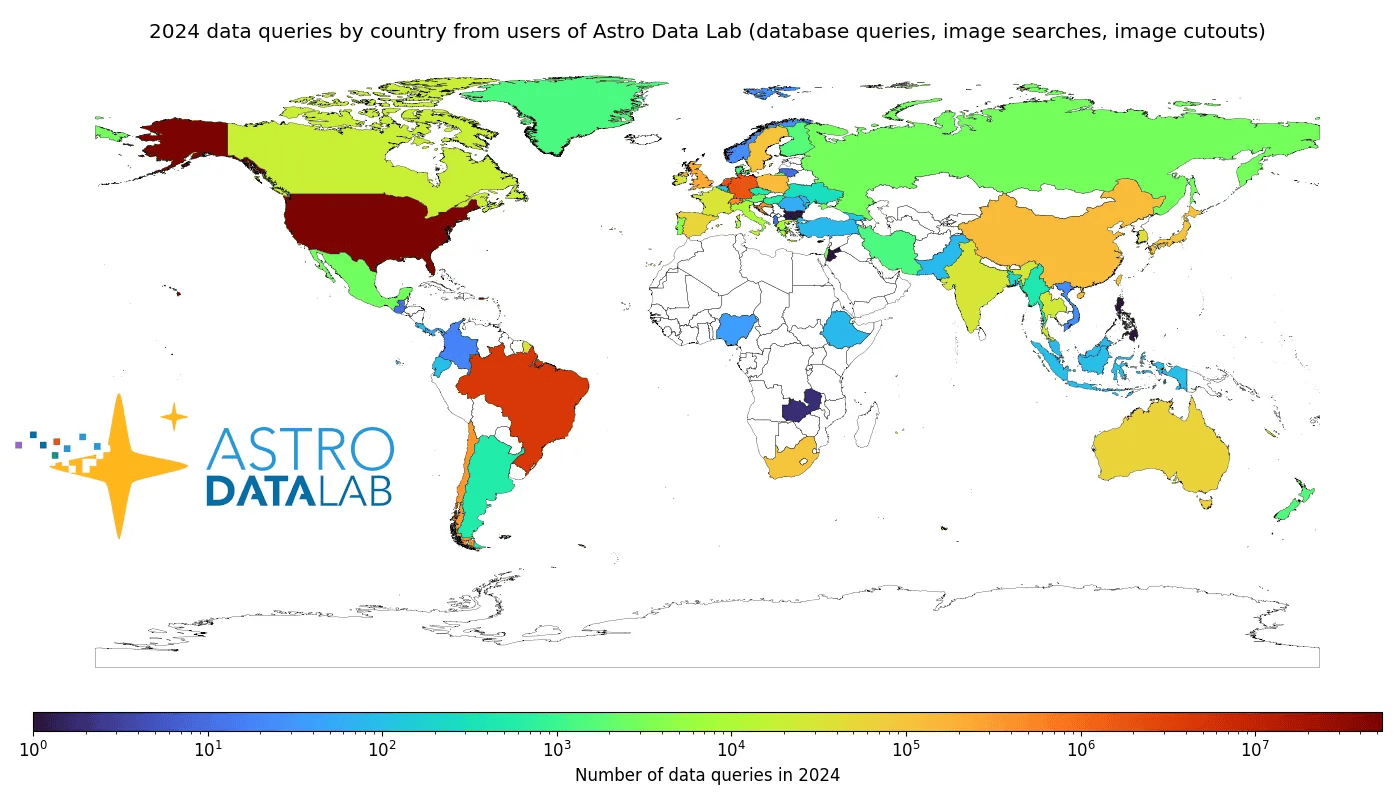
Figure: World map of 2024 number of data queries at Astro Data Lab by country (log-scale color): 64.2 million queries from 72 countries that year.
Contact us
You can visit our website, use the helpdesk, reach us via email at datalab@noirlab.edu, and follow us on BlueSky.
Edited by Alice Jacques
