We are happy to share with you the latest developments at Astro Data Lab in this June 2023 newsletter!
In this newsletter
- DESI EDR release
- Experimental Jupyter notebook server in the cloud
- New data reduction capabilities (Gemini DRAGONS and Gemini IRAF)
- New datasets at Data Lab
- New Jupyter notebooks
DESI EDR release
The Dark Energy Spectroscopic Instrument (DESI) was built by the Department of Energy (DOE) to conduct a Stage-IV dark energy experiment (Instrument Overview Paper). Over the course of the survey (2021-2026), the DESI collaboration will obtain spectra of about 40 million galaxies and quasars as well as 10 million stars (DESI Collaboration 2016a,b). The NOIRLab Astro Data Lab will serve a selected subset of data from each DESI public data release.
The Early Data Release (EDR; DESI Collaboration 2023) includes nearly 2 million spectra of galaxies, quasars and stars observed during commissioning and survey validation. The main spectroscopic and photometric catalogs are hosted at Data Lab and are available for queries, and the spectra are searchable and retrievable from the new spectra discovery tool SPARCL. SPARCL has been designed to support spectra from DESI and other spectroscopic surveys. The SPARCL client package is pre-installed on Data Lab and can also be installed in a user's local computing environment. See the How to Use SPARCL Jupyter notebook for a guided tour of SPARCL. A number of additional DESI-focused notebooks are described in this newsletter under "New Jupyter notebooks at Data Lab". These value-added services are provided for convenience to the astronomy community, with a reminder that any use of DESI data must be accompanied by the official DESI acknowledgments.
For more information about DESI EDR at Astro Data Lab, see the DESI EDR landing page, and our updated collection of example Jupyter notebooks.
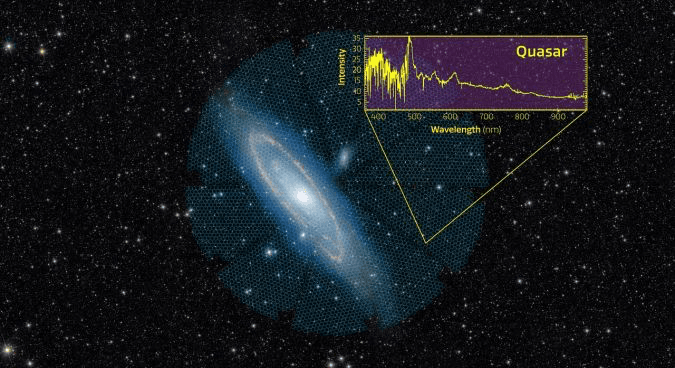
Figure: The disk of the Andromeda Galaxy (M31) spans more than 3 degrees across the sky and fits within a single DESI pointing, represented by the large circular overlay. The smaller circles within this overlay represent the regions accessible to each of the 5000 DESI robotic fiber positioners. The example DESI spectrum that overlays this image is of a distant quasar that is 11 billion years old and lies within the same DESI pointing as Andromeda. (Credit: DESI collaboration/DESI Legacy Imaging Surveys/LBNL/DOE & KPNO/CTIO/NOIRLab/NSF/AURA/unWISE)
Experimental Jupyter notebook server in the cloud
Together with the launch of DESI EDR, Data Lab is offering a new Jupyter notebook server on Google Cloud Platform (GCP) as an "open beta": https://cloud.datalab.noirlab.edu. We invite Data Lab users to try it out, especially if they experience congestion issues at the default / in-house notebook server (https://datalab.noirlab.edu/devbooks/). Both servers are being operated concurrently in this phase.
A note about the current capabilities, limitations and expectations regarding the experimental cloud-based server:
- All registered Data Lab users can log in with their Data Lab credentials.
- our files from the on-prem notebook server are not present on GCP, i.e., it is an entirely separate server.
- There is currently no synchronization of user data between the cloud and in-house notebook servers. If you change files on one server, the changes won't be reflected on the other.
- The cloud server can be taken down for maintenance at any time. While we expect that files written to disk will persist between server restarts, we do not guarantee it at this time. Please make sure to copy any important files off the cloud server. You can use VOspace (using storeClient), or copy the files to your computer (right-click, Download).
- The default Data Lab software stack is installed on the cloud server (in the "Python 3" kernel). We plan to add other kernels in the future. That means that a few of the default Data Lab notebooks won't run on GCP at the moment.
- Your remote file storage (VOSpace) is not linked on the cloud notebook server, like it is on the in-house server (under
vospace/), but you can of course interface with your VOSpace using Data Lab'sstoreClient. - File storage local to the notebook server may be limited.
- Upon launching the cloud server, users must select between three instance RAM sizes: small (3 GB), medium (6 GB), or large (9 GB). Please try to be judicious with how much RAM you really need. Start with the smallest instance possible. The vast majority of notebooks run absolutely fine with 3 GB of RAM.
- Idling notebooks will be culled after 6 hours of inactivity.
- Response time to problems users encounter might be a little bit longer, depending on traffic volume. But we invite users to submit comments, suggestions, and experience reports to our Help Desk. This is very valuable to us for future development.
New data reduction capabilities
Users of the International Gemini Observatory can now reduce data for GMOS (Gemini Multi-Object Spectrographs) imaging and long-slit spectroscopy directly on the Data Lab Science Platform. The latest software versions of DRAGONS (Data Reduction for Astronomy from Gemini Observatory North and South) and Gemini IRAF/Pyraf are available as kernels on Data Lab. Non-proprietary raw data frames are downloaded directly from the Gemini Observatory Archive. There are two introductory notebooks that demonstrate, step-by-step, the new data reduction capabilities, described below.
1. Gemini GMOS photometry data reduction using DRAGONS Python API
Authors: Susan Ridgway, Vinicius Placco
DRAGONS Jupyter notebook that works in the Data Lab environment to fully reduce example GMOS G band imaging data. It uses a custom kernel DRAGONS (Py3.7). The steps include downloading data from the Gemini archive, setting up a DRAGONS calibration service, processing of flat and bias frames, and finally the creation of a single combined stacked image. This is a modified version of the DRAGONS Jupyter notebook tutorial. Also see the general DRAGONS data reduction tutorial from Gemini.
2. Gemini GMOS Longslit Spectroscopy data reduction using Pyraf
Authors: Brian Molina Merino, Vinicius Placco
Gemini GMOS notebook that works in the Data Lab environment to fully reduce GMOS longslit B600 spectroscopy data. Uses custom kernel Gemini (Py 2.7). This is a version of the GMOS longslit Hamamatsu reduction tutorial. The general GMOS data reduction cookbook from the US National Gemini Office is linked here. The object in this example is the standard star HD166379, observed as part of the Gemini North program GN-2018B-Q-54.
New datasets at Data Lab
Data Lab has recently incorporated several new datasets for use by the community: Dark Energy Spectroscopic Instrument Early Data Release (DESI EDR) and Legacy Surveys DR10 (LS DR10).
| Recently added catalogs at Astro Data Lab | |||
|---|---|---|---|
| Dataset | Number of objects | Survey area (deg²) | Bands |
| DESI EDR | 2.0 M | ∼1,390 | spectroscopy: 360-982.4 nm |
| LS DR10 | 3.1 B | 22,645 | griz, W1, W2, W3, W4 |
The Astro Data Lab team has already crossmatched the catalogs above with our reference datasets: Gaia DR3 (for astrometry), AllWISE, NSC DR2, unWISE DR1 (for photometry), and SDSS DR17 (for spectroscopy), and vice versa. We have also added a few other useful columns such as nest4096, ring256, and htm9 sky tessellation use cases. These pre-crossmatched tables are accessible in the schema browser, and through standard TAP/SQL/ADQL queries, like all other catalogs at Data Lab.
The Astro Data Lab team evaluates periodically which external survey datasets we should source, ingest, and serve. We appreciate requests and suggestions from our users. Please contact us at datalab@noirlab.edu to send your request and, if possible, mention an example scientific use case.
LS DR10
The latest release from the Dark Energy Spectroscopic Instrument (DESI) Legacy Imaging Surveys team, LS DR10 significantly expands its photometric observations to >20,000 square degrees, and includes entirely new imaging in the i-band, in addition to grz imaging and four infrared bands from NEOWISE. The imaging includes DECaLS imaging taken with the Dark Energy Camera (DECam), as well as imaging associated with the Dark Energy Survey (DES).
However, imaging of the Northern sky from BASS and MzLS are not included in LS DR10. For convenience, we serve both the DR10-South main photometry table (ls_dr10.tractor_s) and a combined table comprising that table and its DR9-North counterpart (ls_dr9.tractor_n), called simply ls_dr10.tractor, along with corresponding combined table of aperture flux values from the DR10-South (ls_dr10.apflux_s) with its DR9-North counterpart (ls_dr9.apflux_n) called ls_dr10.apflux, and also a combined WISE light curves photometry table from DR10-South (ls_dr10.wise_s) with its counterpart from DR9-North (ls_dr9.wise_n), called ls_dr10.wise.
New Jupyter notebooks
Data Lab curates an extensive collection of notebooks for our user community, which range from introductory, over technical, educational, to entire science use cases. Several new notebooks were recently added to the suite:
1. Introduction to DESI Early Data Release (EDR) at the Astro Data Lab
Authors: Ragadeepika Pucha (U.Arizona), Stéphanie Juneau (NOIRLab), Alice Jacques (NOIRLab), Benjamin Weaver (NOIRLab), and the Astro Data Lab Team, with contributions from Anthony Kremin (LBL), Stephen Bailey (LBL) and the DESI Collaboration
Introduction to the DESI Early Data Release (DESI EDR) at Astro Data Lab. Information about the release can be found here. The notebook focuses on how to query the redshift catalogs from the Data Lab database and how to separate sources based on the DESI targeting information. It also shows how to access all available spectra of any given object via SPARCL (SPectra Analysis and Retrievable Catalog Lab), and finally how to plot the "best" spectrum.
2. Comparing SDSS and DESI spectra using SPARCL
Authors: Ragadeepika Pucha (U.Arizona), Stéphanie Juneau (NOIRLab), and the Astro Data Lab Team
Using SPARCL to compare SDSS DR16 and DESI EDR spectra. The notebook showcases the use of the SPARCL data discovery tool to access all available spectra in a specific region of the sky, with redshift and spectype constraints. It also highlights the flux and spectral resolution differences between the two surveys by focusing on the [OII]-doublet region of the spectra. Another useful tutorial for comparing these spectra using the interactive Prospect spectral viewer is available here. The comparison between the SDSS (BOSS) and DESI spectroscopic instruments and surveys is summarized in the table below.
| Comparison of SDSS (BOSS) and DESI Spectroscopic Instruments and Surveys | ||
|---|---|---|
| Property | SDSS (BOSS) | DESI spectrograph |
| Fiber size | 3" diameter (2" diameter) | 1.5" diameter |
| Number of spectra at a single time | 640 (1,000) | 5,000 |
| Wavelength coverage | 3,800 - 9,200 Angstroms | 3,600 - 9,800 Angstroms |
| Spectral resolution | 110 - 190 km/s | 60 - 150 km/s |
| Targets | r < 17.7 mag | r < 24.5 mag |
| Spatial density | ∼90 deg⁻² | ∼700 deg⁻² |
3. How to query DESI EDR data
Authors: Benjamin Weaver, Alice Jacques
Demonstrates how to query for data from the DESI EDR pipeline outputs using the Data Lab database. It explores the contents of the desi_edr database, and covers simple and complex (JOIN) queries, matching redshift tables to targeting data, and shows how to track the progress of the DESI survey. Aims to reproduce closely DESI's introductory notebook tutorial.
4. Photometric reverberation mapping of AGNs
Authors: Isidora Jankov, Andjelka Kovacevic, Dragana Ilic, Paula Sánchez-Sáez, Robert Nikutta
This notebook is a demonstration of techniques developed for the research published in Kovačević et al. (2021b) and Jankov et al. (2022), and serves as a complete practical guide on how to perform photometric reverberation mapping of the broad line region of active galactic nuclei (AGN). The first part of the notebook shows three ways of acquiring photometric light curves: from alert broker ANTARES, from ZTF data releases, and by generating artificial light curves using the method described in Kovačević et al. (2021b). The second part demonstrates the photometric reverberation mapping method on a pair of simulated light curves, where photRM and pyzdcf modules are introduced and used.
5. Using Gaia DR3 to identify hyper-runaway and hypervelocity white dwarf candidates
Authors: Alice Jacques and the Astro Data Lab Team
This notebook reproduces Figures 1, 3, and 4 from Igoshev et al. 2023 "Hyper-runaway and hypervelocity white dwarf candidates in Gaia Data Release 3: possible remnants from Ia/Iax supernova explosions or dynamical encounters". In their paper, Igoshev et al. use data from Gaia DR3 (Gaia Collaboration et al. 2016b and 2022k) to search for and analyze white dwarfs and other peculiar objects possibly ejected from the Galactic disk at very high velocities (> 400 km/s) because of thermonuclear type Ia/Iax peculiar supernovae (SNe) or dynamical encounters. The figures reproduced in this notebook show the locations of 46 hyper-runaway/hypervelocity (HVS) white dwarf (WD) candidates on the Hertzsprung–Russell diagram as well as their transversal velocities and heights above/below the Galactic plane.
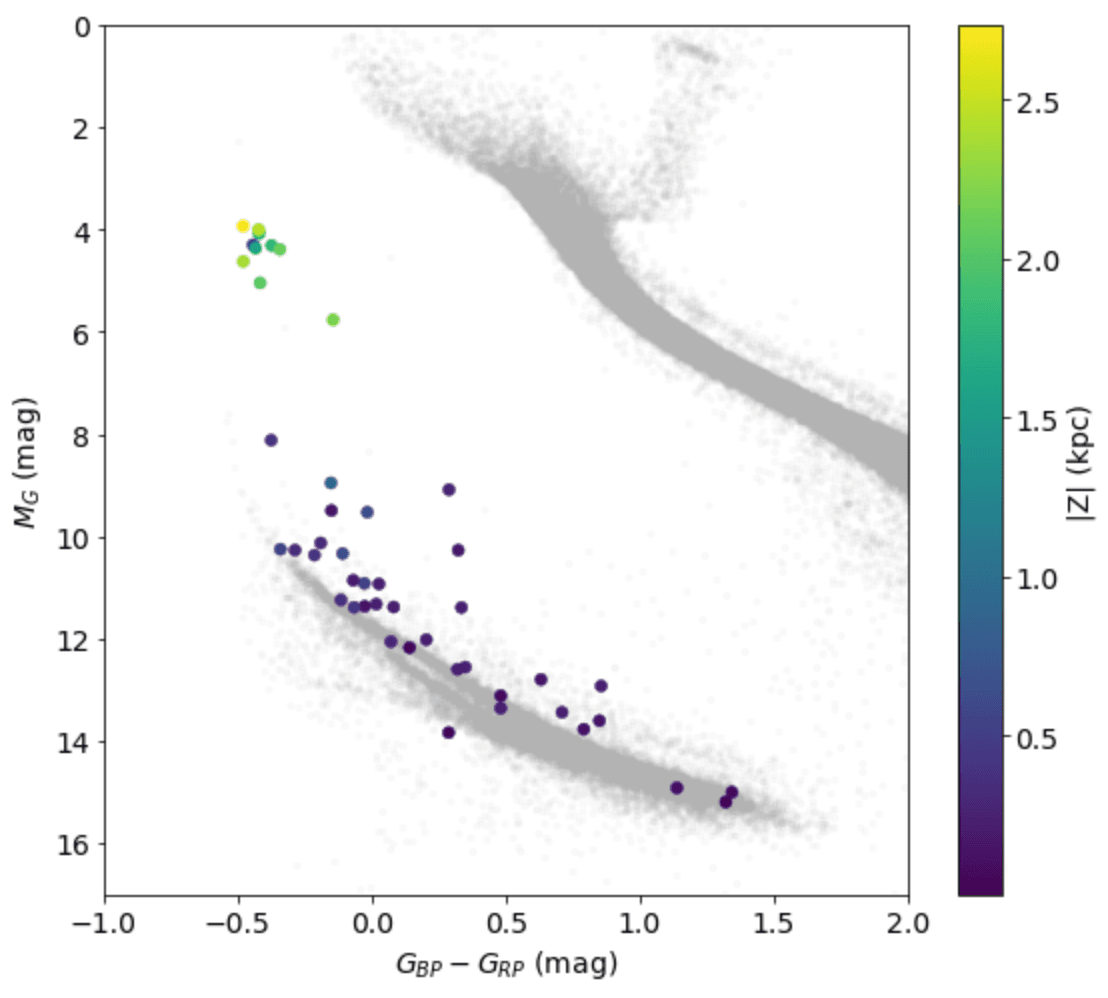
Figure: Location of the HVS WD candidates on the HR diagram, colored by the absolute vertical distance above/below the Galactic disc. Gaia DR3 objects within 100 pc of the sun are plotted in greyscale for reference.
6. ANTARES, ATLAS, WISE, and Spitzer Photometry Search
Author: Ryan M. Lau
The notebook demonstrates how to generate light curves and output photometry using multiple optical and IR datasets. It incorporates a search for the latest optical data from ZTF and ATLAS as well as archival IR data from Spitzer and (NEO)WISE. Photometric data from ZTF are obtained using the dedicated client ANTARES alert broker client. Light curves from (NEO)WISE are obtained using the unTimely Catalog Explorer. Forced photometry is then performed on archival Ch1 and Ch2 Spitzer Infrared Array Camera (IRAC) images from the Spitzer Heritage Archive, and an ATLAS API is used to submit requests to the ATLAS forced photometry server. Photometry from Spitzer and WISE are not difference-image subtracted, whereas the ZTF photometry is difference-image subtracted.
7. DECaLS and SDSS/BOSS Large Scale Structure
Authors: Stéphanie Juneau, David Herrera, and the Astro Data Lab Team
We updated this notebook with a section that interactively plots a sample of SDSS galaxies in 3D, using their sky coordinates and redshift. The plot can be explored interactively by zooming, panning, and rotating the scene, immediately revealing galaxy clusters and large-scale filaments. This is all courtesy of the versatile Python library Plotly.
Contact Astro Data Lab
You can visit our website, use the Helpdesk, reach us via email, and follow us on Twitter.
Currently registered and active users have been subscribed to this Newsletter mailing list. To unsubscribe, send an empty email to datalab-newsletter-unsubscribe@mailman.tuc.noirlab.edu and follow the instructions in the verification email to confirm.
