DELVE DR2 MDN Photometric Redshifts
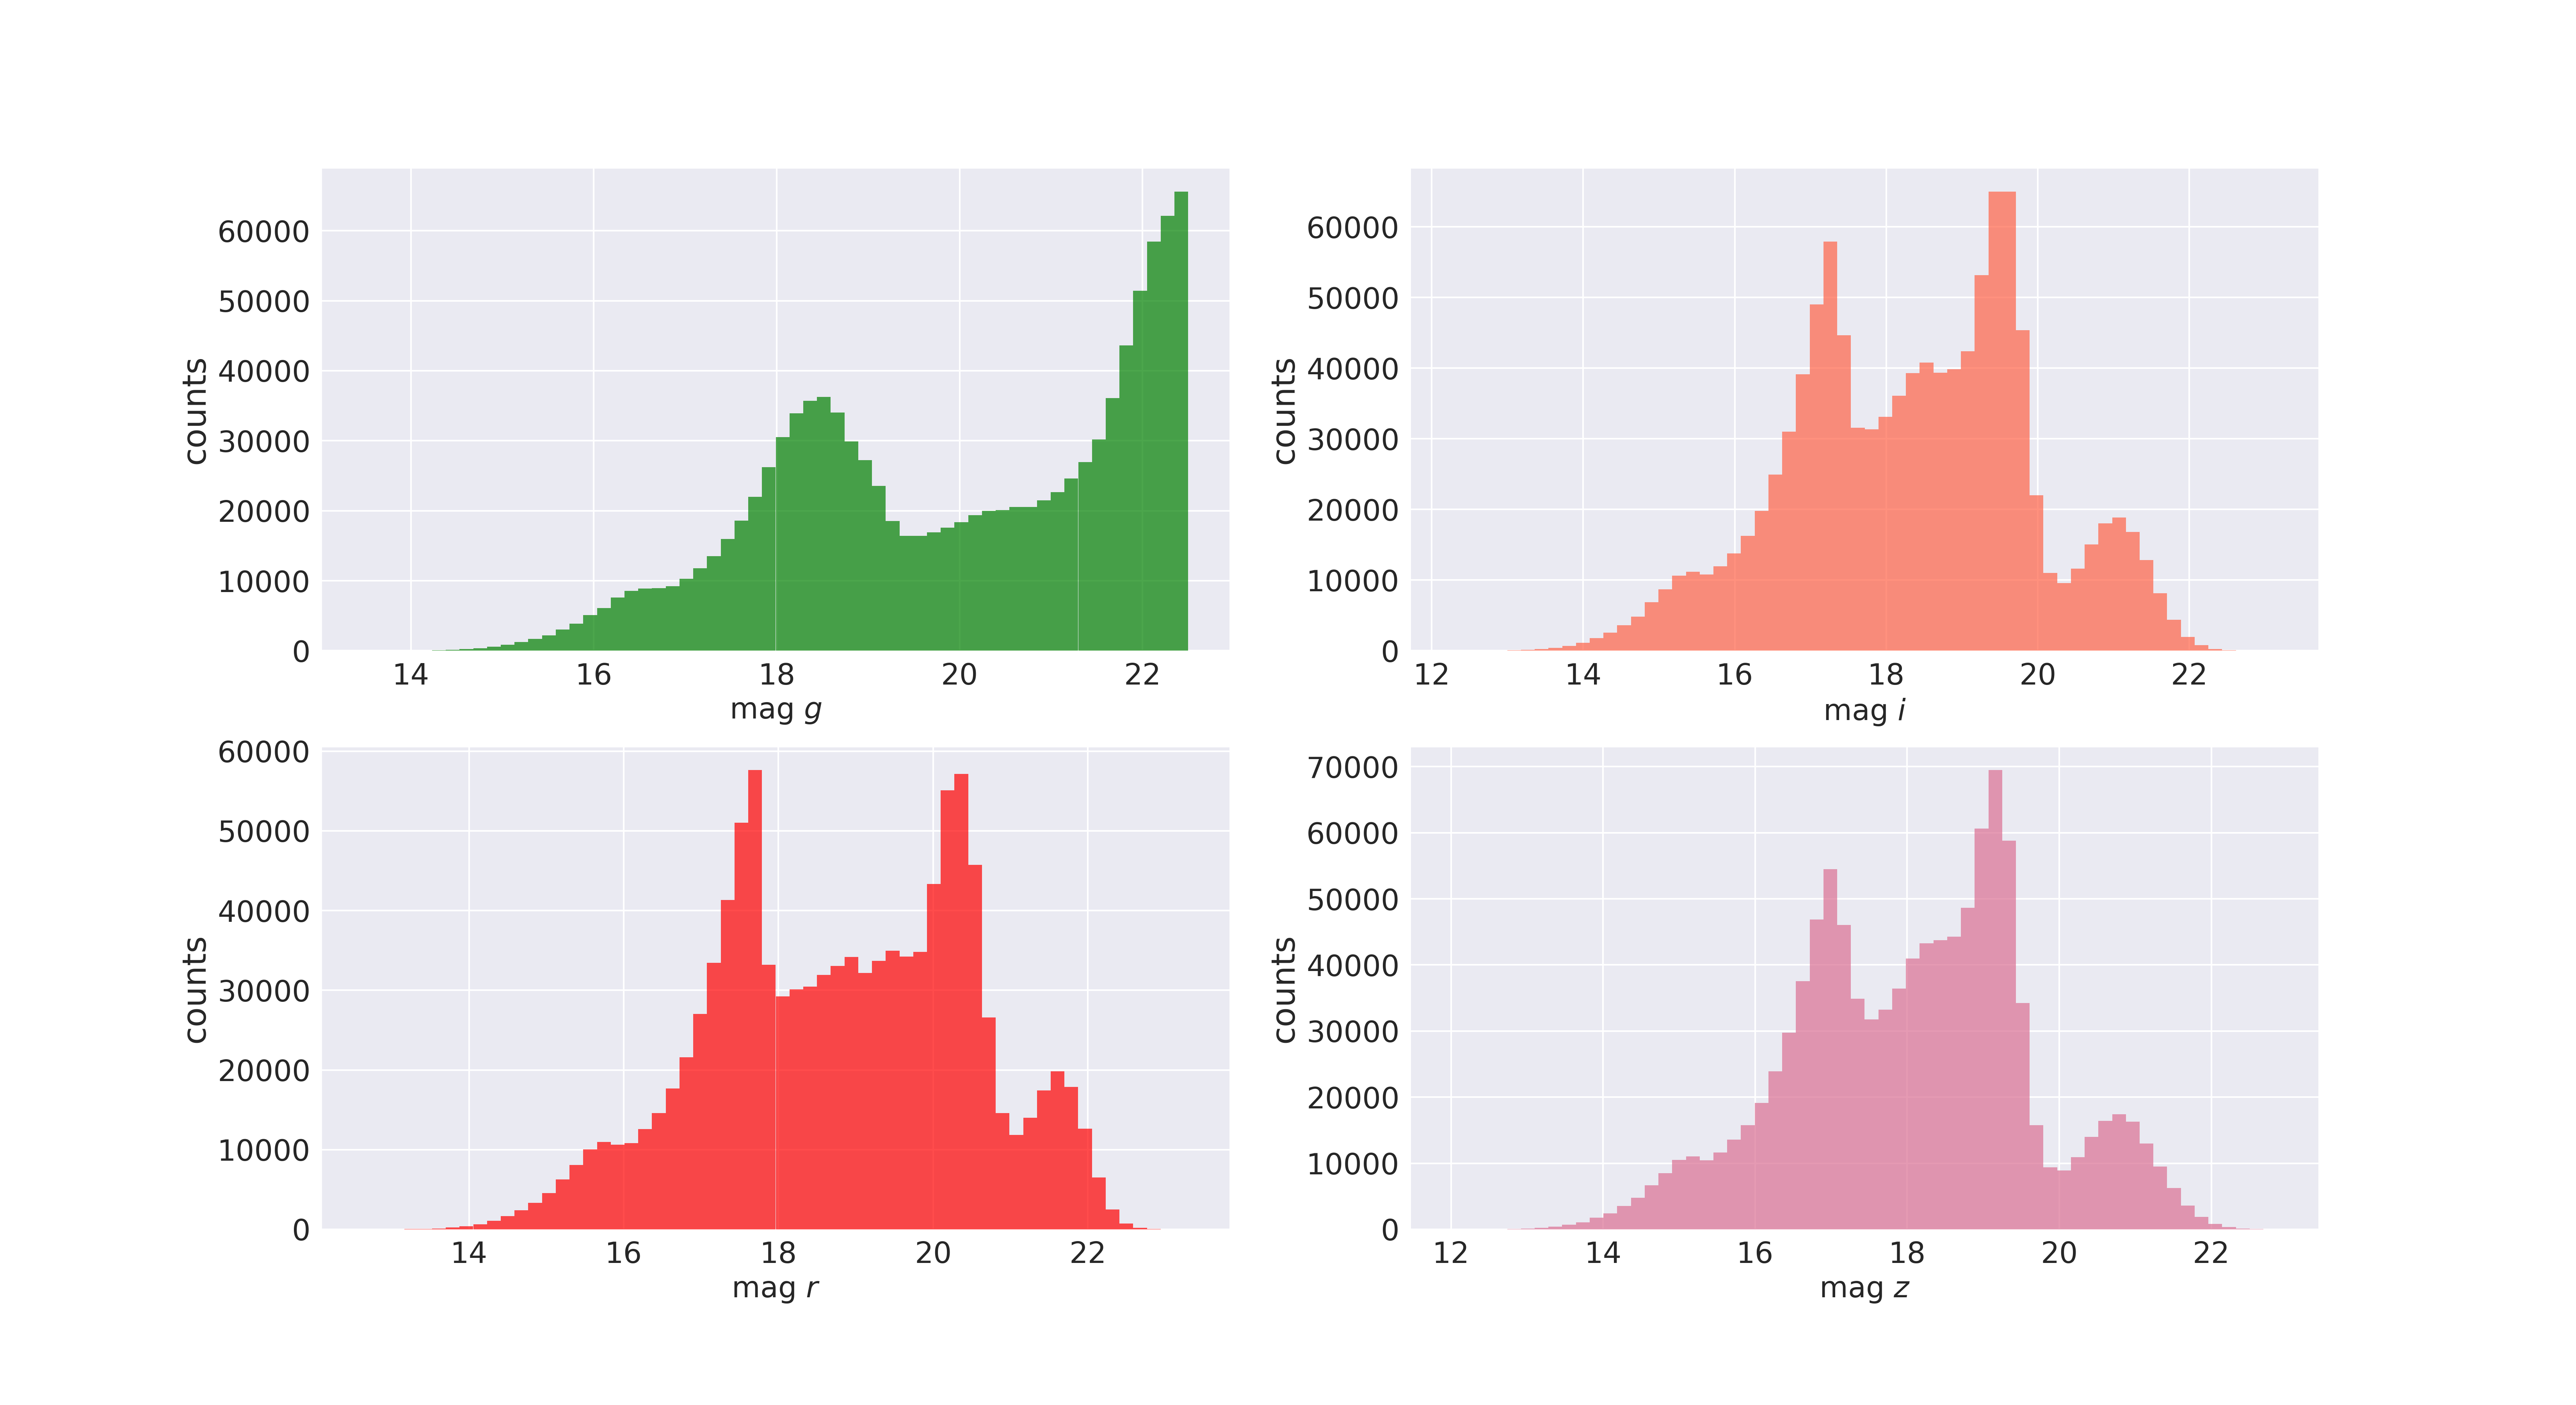
We derive a sample of photometric redshift estimates for objects in the DELVE DR2 catalog using a Mixture Density Network (MDN) trained on griz magnitudes and colors. This network outputs the weights, means, and standard deviations of 20 Gaussian distributions, which are then combined into a single probability density function (PDF) from which samples of the photo-z can be drawn. The resulting photo-z information can be accessed using the interfaces described on the Data Access page, and the delve_dr2.photoz table can be browsed using the Data Lab table browser.
More information about the construction and quality of this value added catalog can be found below.
Training Data
The MDN photo-z estimator was trained on a sample of objects with measured spectroscopic redshifts. This spec-z catalog was assembled by cross-matching sources from DELVE DR2 with several spectroscopic catalogs: SDSS, 2DF, 6DF, VIPERS, GAMA, 2dFLens, DES_AAOMEGA, DES_IMACS, WIGGLEZ, DEEP2, 3D-HST, VVDS, CLASH-VLT, ACES, N17B331, SAGA, SPT_GMOS, UDS, C3R2, ATLAS, , VANDELS, SPARCS, GLASS, CDB, ELG FIGS, VUDS, ZFIRE, and MOSFIRE.
We selected the matched objects that remained after a set of cuts.- SNR > 5 in the g band and SNR > 3 in the riz bands (when each band was available).
- g < 22.5
- 0.01 < z-spec < 2
- We removed objects with 178 < RA < 182 and Dec < 5 due to issues in a preliminary version of the DELVE catalog.
- Objects with g, r, i and z measurements available were requited to have: (g-r) < 4, -1 < (r-i) < 4, and -1 < (i-z) < 4
- Objects with just g, r and i measurements available were required to have: (g-r) < 4 and -1 < (r-i) < 4
- 13.478 < g < 22.500
- 12.634 < r < 23.297
- 12.270 < i < 22.751
- 12.016 < z < 22.859
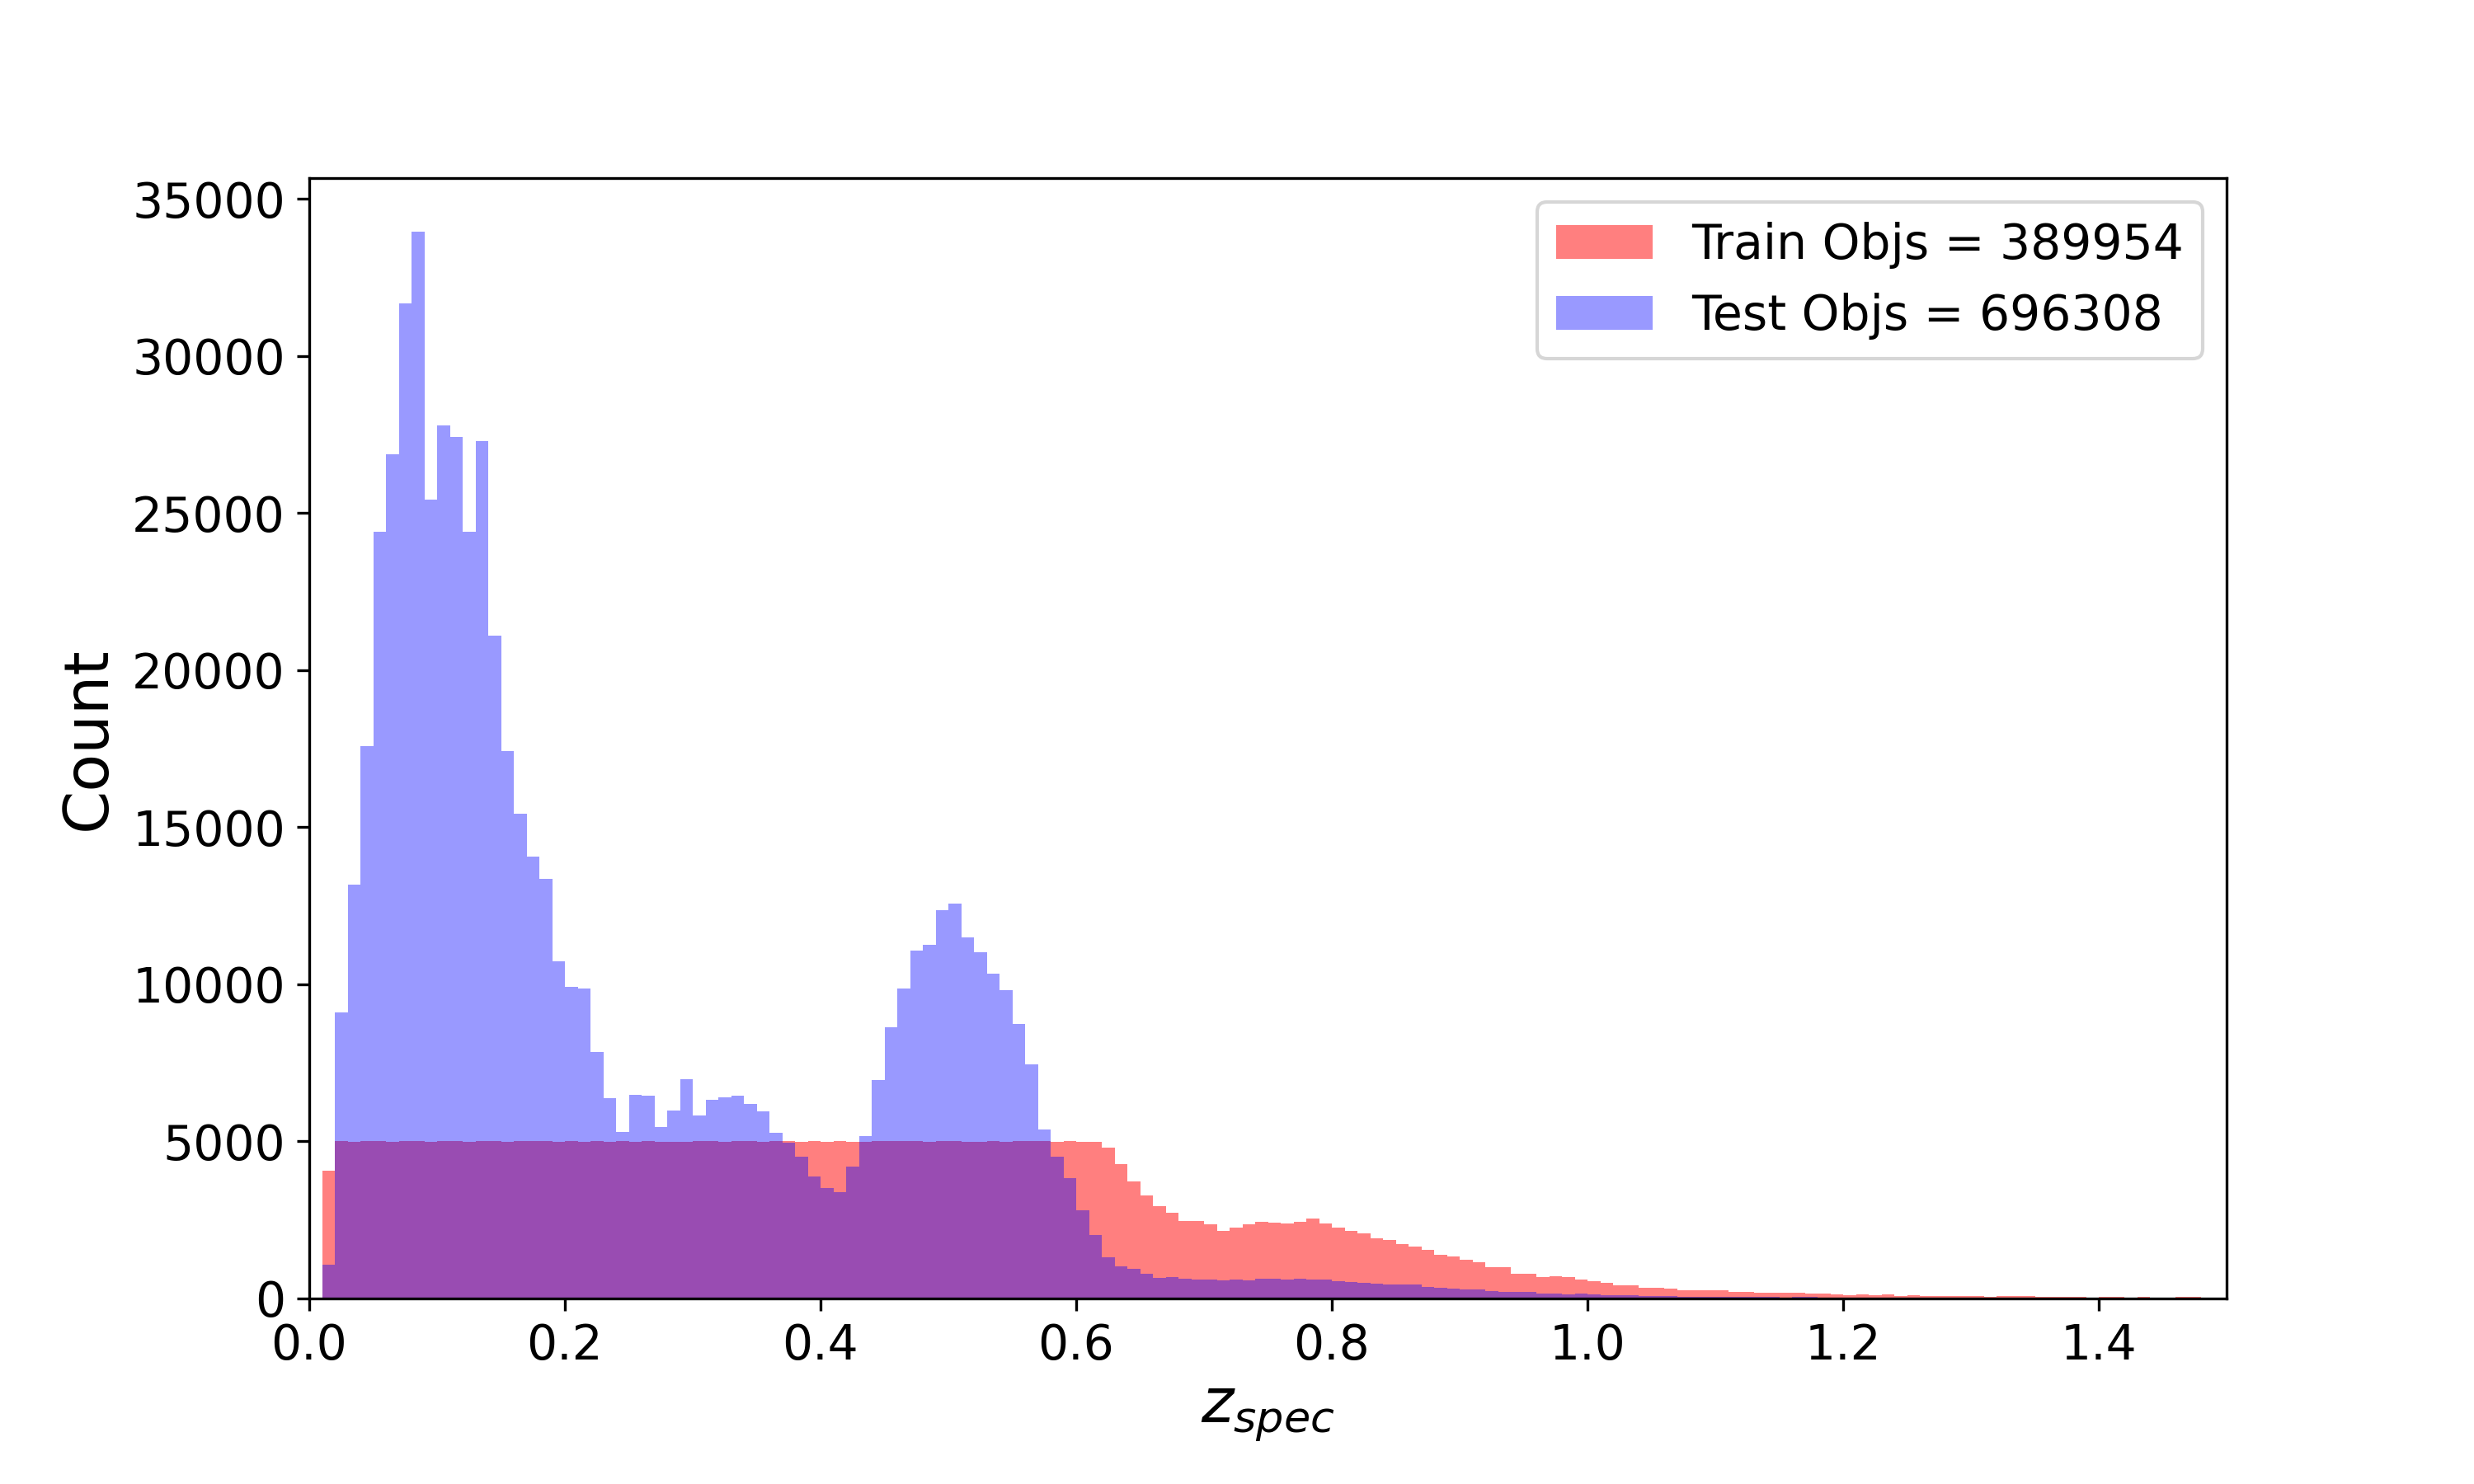
 Below we show the spec-z distribution (bin size = 0.01) of the training and testing samples. The training sample was selected to be as uniform as possible in redshift to avoid biases. In practice, this resulted in a flat distribution up to z = 0.6.

Performance Metrics
We used point estimates (taking the most probable value from the PDF) to build our metrics (“point-like metrics”). We define the following metrics:- The photo-z bias is defined as Δz = zphot - zspec.
- The median bias, median(Δz), is useful for identifying possible systematic effects in the redshift estimation
- The outlier fraction is defined as |Δz|/( 1 + zspec) > 0.15 within a given redshift bin.
- The normalized median absolute deviation measures the dispersion of the bias and is defined as σNMAD = 1.48 × median(| (Δz - median(Δz)) / (1 + zspec) |)
- The relative errors are defined as mean( Δz / (1 + z) ) within photo-z intervals of 0.05.


